Measures branching in C++ from python
Links: notebook, html, PDF, python, slides, GitHub
This notebook looks into a couple of ways to write code, which one is efficient, which one is not when it comes to write fast and short loops. Both experiments are around branching. The notebook relies on C++ code implemented in cbenchmark.cpp and repeat_fct.h.
from jyquickhelper import add_notebook_menu
add_notebook_menu()
%matplotlib inline
numpy is multithreaded. For an accurate
comparison, this needs to be disabled. This can be done as follows or by
setting environment variable MKL_NUM_THREADS=1.
try:
    import mkl
    mkl.set_num_threads(1)
except ModuleNotFoundError as e:
    print('mkl not found', e)
    import os
    os.environ['MKL_NUM_THREADS']='1'
First experiment: comparison C++ syntax
This all started with article Why is it faster to process a sorted array than an unsorted array?. It compares different implementation fo the following function for which we try different implementations for the third line in next cell. The last option is taken Checking whether a number is positive or negative using bitwise operators which avoids branching.
# int nb = 0;
# for(auto it = values.begin(); it != values.end(); ++it)
#     if (*it >= th) nb++; // this line changes
#     if (*it >= th) nb++; // and is repeated 10 times inside the loop.
#     // ... 10 times
# return nb;
The third line is also repeated 10 times to avoid the loop being too significant.
from cpyquickhelper.numbers.cbenchmark_dot import measure_scenario_A, measure_scenario_B
from cpyquickhelper.numbers.cbenchmark_dot import measure_scenario_C, measure_scenario_D
from cpyquickhelper.numbers.cbenchmark_dot import measure_scenario_E, measure_scenario_F
from cpyquickhelper.numbers.cbenchmark_dot import measure_scenario_G, measure_scenario_H
from cpyquickhelper.numbers.cbenchmark_dot import measure_scenario_I, measure_scenario_J
import pandas

def test_benchmark(label, values, th, repeat=10, number=20):
    funcs = [(k, v) for k, v in globals().copy().items() if k.startswith("measure_scenario")]
    rows = []
    for k, v in funcs:
        exe = v(values, th, repeat, number)
        d = exe.todict()
        d['doc'] = v.__doc__.split('``')[1]
        d['label'] = label
        d['name'] = k
        rows.append(d)
    df = pandas.DataFrame(rows)
    return df

test_benchmark("sorted", list(range(10)), 5)
| average | deviation | doc | label | max_exec | min_exec | name | number | repeat | |
|---|---|---|---|---|---|---|---|---|---|
| 0 | 6.518500e-08 | 2.870060e-07 | if (values[i] >= th) ++nb; | sorted | 1.581000e-06 | 0.000001 | measure_scenario_A | 20.0 | 10.0 |
| 1 | 5.926000e-08 | 2.583084e-07 | if (*it >= th) ++nb; | sorted | 1.186000e-06 | 0.000001 | measure_scenario_B | 20.0 | 10.0 |
| 2 | 6.123500e-08 | 2.682277e-07 | if (*it >= th) nb++; | sorted | 1.580000e-06 | 0.000001 | measure_scenario_C | 20.0 | 10.0 |
| 3 | 1.185000e-08 | 6.738195e-08 | nb += *it >= th ? 1 : 0; | sorted | 3.950000e-07 | 0.000000 | measure_scenario_D | 20.0 | 10.0 |
| 4 | 6.123500e-08 | 2.682277e-07 | if (*it >= th) nb += 1; | sorted | 1.580000e-06 | 0.000001 | measure_scenario_E | 20.0 | 10.0 |
| 5 | 7.900000e-09 | 5.530000e-08 | nb += (*it - th) >= 0 ? 1 : 0; | sorted | 3.950000e-07 | 0.000000 | measure_scenario_F | 20.0 | 10.0 |
| 6 | 1.580500e-08 | 7.742840e-08 | nb += (*it - th) < 0 ? 1 : 0; | sorted | 3.960000e-07 | 0.000000 | measure_scenario_G | 20.0 | 10.0 |
| 7 | 1.383000e-08 | 7.261929e-08 | nb += *it < th ? 1 : 0; | sorted | 3.960000e-07 | 0.000000 | measure_scenario_H | 20.0 | 10.0 |
| 8 | 1.777500e-08 | 8.188513e-08 | nb += 1 ^ ((unsigned int)(*it) >> (sizeof(int)... | sorted | 3.950000e-07 | 0.000000 | measure_scenario_I | 20.0 | 10.0 |
| 9 | 1.383000e-08 | 7.261929e-08 | nb += values[i] >= th ? 1 : 0; | sorted | 3.960000e-07 | 0.000000 | measure_scenario_J | 20.0 | 10.0 |
Times are not very conclusive on such small lists.
values = list(range(100000))
df_sorted = test_benchmark("sorted", values, len(values)//2, repeat=200)
df_sorted
| average | deviation | doc | label | max_exec | min_exec | name | number | repeat | |
|---|---|---|---|---|---|---|---|---|---|
| 0 | 0.001116 | 0.004947 | if (values[i] >= th) ++nb; | sorted | 0.047184 | 0.014096 | measure_scenario_A | 20.0 | 200.0 |
| 1 | 0.001136 | 0.005057 | if (*it >= th) ++nb; | sorted | 0.038252 | 0.014688 | measure_scenario_B | 20.0 | 200.0 |
| 2 | 0.001133 | 0.005100 | if (*it >= th) nb++; | sorted | 0.044802 | 0.013577 | measure_scenario_C | 20.0 | 200.0 |
| 3 | 0.000118 | 0.000528 | nb += *it >= th ? 1 : 0; | sorted | 0.004973 | 0.001436 | measure_scenario_D | 20.0 | 200.0 |
| 4 | 0.000831 | 0.003742 | if (*it >= th) nb += 1; | sorted | 0.048095 | 0.013466 | measure_scenario_E | 20.0 | 200.0 |
| 5 | 0.000118 | 0.000564 | nb += (*it - th) >= 0 ? 1 : 0; | sorted | 0.013677 | 0.001338 | measure_scenario_F | 20.0 | 200.0 |
| 6 | 0.000170 | 0.000786 | nb += (*it - th) < 0 ? 1 : 0; | sorted | 0.007175 | 0.001582 | measure_scenario_G | 20.0 | 200.0 |
| 7 | 0.000090 | 0.000414 | nb += *it < th ? 1 : 0; | sorted | 0.004574 | 0.001296 | measure_scenario_H | 20.0 | 200.0 |
| 8 | 0.000119 | 0.000518 | nb += 1 ^ ((unsigned int)(*it) >> (sizeof(int)... | sorted | 0.002834 | 0.002243 | measure_scenario_I | 20.0 | 200.0 |
| 9 | 0.000081 | 0.000360 | nb += values[i] >= th ? 1 : 0; | sorted | 0.004324 | 0.001459 | measure_scenario_J | 20.0 | 200.0 |
The article some implementations will be slower if the values are not sorted.
import random
random.shuffle(values)
values = values.copy()
values[:10]
[73680, 56372, 84502, 10263, 93712, 12350, 98785, 54243, 7299, 30309]
df_shuffled = test_benchmark("shuffled", values, len(values)//2, repeat=200)
df_shuffled
| average | deviation | doc | label | max_exec | min_exec | name | number | repeat | |
|---|---|---|---|---|---|---|---|---|---|
| 0 | 0.000704 | 0.003076 | if (values[i] >= th) ++nb; | shuffled | 0.019643 | 0.013091 | measure_scenario_A | 20.0 | 200.0 |
| 1 | 0.000697 | 0.003042 | if (*it >= th) ++nb; | shuffled | 0.016656 | 0.013203 | measure_scenario_B | 20.0 | 200.0 |
| 2 | 0.000761 | 0.003440 | if (*it >= th) nb++; | shuffled | 0.027062 | 0.013112 | measure_scenario_C | 20.0 | 200.0 |
| 3 | 0.000128 | 0.000563 | nb += *it >= th ? 1 : 0; | shuffled | 0.004075 | 0.001579 | measure_scenario_D | 20.0 | 200.0 |
| 4 | 0.001281 | 0.005590 | if (*it >= th) nb += 1; | shuffled | 0.028929 | 0.018232 | measure_scenario_E | 20.0 | 200.0 |
| 5 | 0.000126 | 0.000554 | nb += (*it - th) >= 0 ? 1 : 0; | shuffled | 0.003189 | 0.001542 | measure_scenario_F | 20.0 | 200.0 |
| 6 | 0.000144 | 0.000634 | nb += (*it - th) < 0 ? 1 : 0; | shuffled | 0.005403 | 0.001844 | measure_scenario_G | 20.0 | 200.0 |
| 7 | 0.000128 | 0.000560 | nb += *it < th ? 1 : 0; | shuffled | 0.003976 | 0.001567 | measure_scenario_H | 20.0 | 200.0 |
| 8 | 0.000223 | 0.000974 | nb += 1 ^ ((unsigned int)(*it) >> (sizeof(int)... | shuffled | 0.007231 | 0.002795 | measure_scenario_I | 20.0 | 200.0 |
| 9 | 0.000140 | 0.000687 | nb += values[i] >= th ? 1 : 0; | shuffled | 0.016393 | 0.001547 | measure_scenario_J | 20.0 | 200.0 |
df = pandas.concat([df_sorted, df_shuffled])
dfg = df[["doc", "label", "average"]].pivot("doc", "label", "average")
ax = dfg.plot.bar(rot=30)
labels = [l.get_text() for l in ax.get_xticklabels()]
ax.set_xticklabels(labels, ha='right')
ax.set_title("Comparison of all implementations");
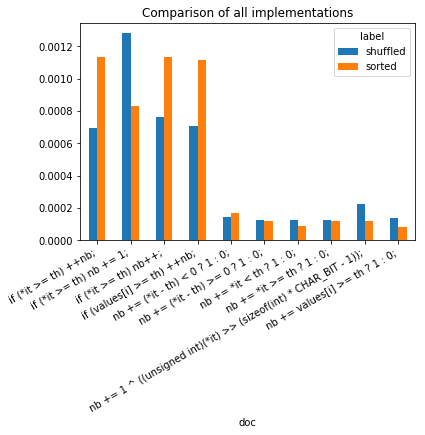
It seems that inline tests (cond ? value1 : value2) do not stop the
branching and it should be used whenever possible.
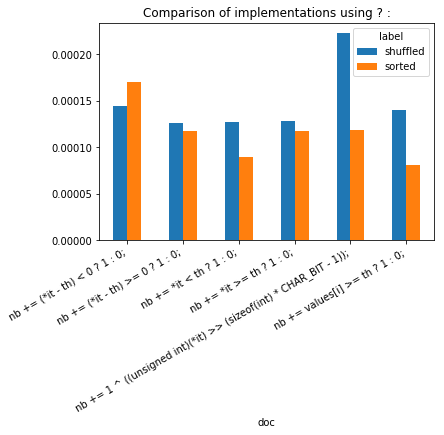
sdf = df[["doc", "label", "average"]]
dfg2 = sdf[sdf.doc.str.contains('[?^]')].pivot("doc", "label", "average")
ax = dfg2.plot.bar(rot=30)
labels = [l.get_text() for l in ax.get_xticklabels()]
ax.set_xticklabels(labels, ha='right')
ax.set_title("Comparison of implementations using ? :");
sdf = df[["doc", "label", "average"]]
dfg2 = sdf[sdf.doc.str.contains('if')].pivot("doc", "label", "average")
ax = dfg2.plot.bar(rot=30)
labels = [l.get_text() for l in ax.get_xticklabels()]
ax.set_xticklabels(labels, ha='right')
ax.set_ylim([0.0004, 0.0020])
ax.set_title("Comparison of implementations using tests");
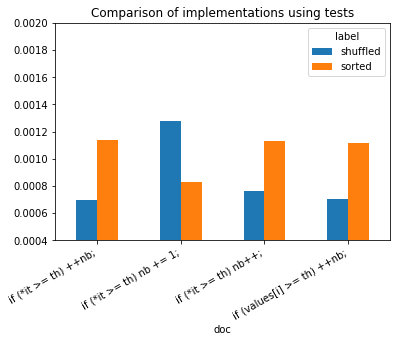
sorted, not sorted does not seem to have a real impact in this case.
It shows branching really slows down the execution of a program.
Branching happens whenever the program meets a loop condition or a test.
Iterator *it are faster than accessing an array with notation
[i] which adds a cost due to an extra addition.
Second experiment: dot product
The goal is to compare the dot product from numpy.dot and a couple of implementation in C++ which look like this:
# float vector_dot_product_pointer(const float *p1, const float *p2, size_t size)
# {
#     float sum = 0;
#     const float * end1 = p1 + size;
#     for(; p1 != end1; ++p1, ++p2)
#         sum += *p1 * *p2;
#     return sum;
# }
#
#
# float vector_dot_product(py::array_t<float> v1, py::array_t<float> v2)
# {
#     if (v1.ndim() != v2.ndim())
#         throw std::runtime_error("Vector v1 and v2 must have the same dimension.");
#     if (v1.ndim() != 1)
#         throw std::runtime_error("Vector v1 and v2 must be vectors.");
#     return vector_dot_product_pointer(v1.data(0), v2.data(0), v1.shape(0));
# }
numpy vs C++
numpy.dot
%matplotlib inline
import numpy

def simple_dot(values):
    return numpy.dot(values, values)

values = list(range(10000000))
values = numpy.array(values, dtype=numpy.float32)
vect = values / numpy.max(values)
simple_dot(vect)
3333333.2
vect.dtype
dtype('float32')
from timeit import Timer

def measure_time(stmt, context, repeat=10, number=50):
    tim = Timer(stmt, globals=context)
    res = numpy.array(tim.repeat(repeat=repeat, number=number))
    mean = numpy.mean(res)
    dev = numpy.mean(res ** 2)
    dev = (dev - mean**2) ** 0.5
    return dict(average=mean, deviation=dev, min_exec=numpy.min(res),
                max_exec=numpy.max(res), repeat=repeat, number=number,
                size=context['values'].shape[0])

measure_time("simple_dot(values)", context=dict(simple_dot=simple_dot, values=vect))
{'average': 0.17493714570000024,
 'deviation': 0.01055679328637683,
 'min_exec': 0.16323108099999928,
 'max_exec': 0.1946009330000038,
 'repeat': 10,
 'number': 50,
 'size': 10000000}
res = []
for i in range(10, 200000, 2500):
    t = measure_time("simple_dot(values)", repeat=100,
                     context=dict(simple_dot=simple_dot, values=vect[:i].copy()))
    res.append(t)

import pandas
dot = pandas.DataFrame(res)
dot.tail()
| average | deviation | max_exec | min_exec | number | repeat | size | |
|---|---|---|---|---|---|---|---|
| 75 | 0.001811 | 0.000932 | 0.009380 | 0.001230 | 50 | 100 | 187510 |
| 76 | 0.001646 | 0.000415 | 0.003583 | 0.001249 | 50 | 100 | 190010 |
| 77 | 0.001981 | 0.000676 | 0.004695 | 0.001267 | 50 | 100 | 192510 |
| 78 | 0.002436 | 0.000855 | 0.004890 | 0.001313 | 50 | 100 | 195010 |
| 79 | 0.001886 | 0.000353 | 0.002882 | 0.001327 | 50 | 100 | 197510 |
res = []
for i in range(100000, 10000000, 1000000):
    t = measure_time("simple_dot(values)", repeat=10,
                     context=dict(simple_dot=simple_dot, values=vect[:i].copy()))
    res.append(t)

huge_dot = pandas.DataFrame(res)
huge_dot.head()
| average | deviation | max_exec | min_exec | number | repeat | size | |
|---|---|---|---|---|---|---|---|
| 0 | 0.000914 | 0.000144 | 0.001219 | 0.000820 | 50 | 10 | 100000 |
| 1 | 0.015862 | 0.004123 | 0.027136 | 0.012628 | 50 | 10 | 1100000 |
| 2 | 0.035084 | 0.003601 | 0.042250 | 0.030178 | 50 | 10 | 2100000 |
| 3 | 0.048146 | 0.001690 | 0.050411 | 0.045873 | 50 | 10 | 3100000 |
| 4 | 0.070299 | 0.005897 | 0.086010 | 0.066763 | 50 | 10 | 4100000 |
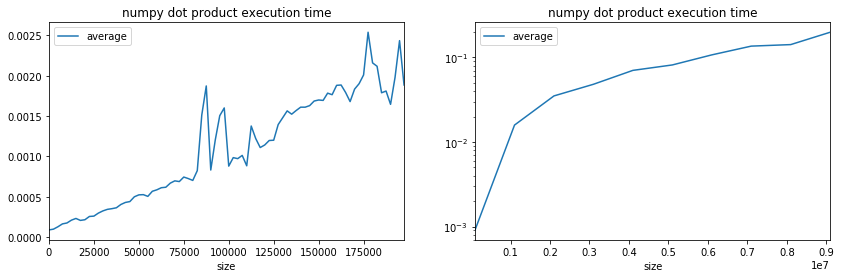
import matplotlib.pyplot as plt
fig, ax = plt.subplots(1, 2, figsize=(14,4))
dot.plot(x='size', y="average", ax=ax[0])
huge_dot.plot(x='size', y="average", ax=ax[1], logy=True)
ax[0].set_title("numpy dot product execution time");
ax[1].set_title("numpy dot product execution time");
numpy.einsum
def simple_dot_einsum(values):
    return numpy.einsum('i,i->', values, values)

values = list(range(10000000))
values = numpy.array(values, dtype=numpy.float32)
vect = values / numpy.max(values)
simple_dot_einsum(vect)
3333333.8
measure_time("simple_dot_einsum(values)",
             context=dict(simple_dot_einsum=simple_dot_einsum, values=vect))
{'average': 0.2862720898999996,
 'deviation': 0.019172035812954895,
 'min_exec': 0.26404798899999093,
 'max_exec': 0.3281182589999929,
 'repeat': 10,
 'number': 50,
 'size': 10000000}
res = []
for i in range(10, 200000, 2500):
    t = measure_time("simple_dot_einsum(values)", repeat=100,
                     context=dict(simple_dot_einsum=simple_dot_einsum, values=vect[:i].copy()))
    res.append(t)

import pandas
einsum_dot = pandas.DataFrame(res)
einsum_dot.tail()
| average | deviation | max_exec | min_exec | number | repeat | size | |
|---|---|---|---|---|---|---|---|
| 75 | 0.004400 | 0.001858 | 0.009241 | 0.003290 | 50 | 100 | 187510 |
| 76 | 0.003400 | 0.000065 | 0.003683 | 0.003320 | 50 | 100 | 190010 |
| 77 | 0.003717 | 0.000703 | 0.007098 | 0.003467 | 50 | 100 | 192510 |
| 78 | 0.003628 | 0.000256 | 0.004555 | 0.003404 | 50 | 100 | 195010 |
| 79 | 0.003660 | 0.000224 | 0.004962 | 0.003448 | 50 | 100 | 197510 |
import matplotlib.pyplot as plt
fig, ax = plt.subplots(1, 1, figsize=(7,4))
dot.plot(x='size', y="average", ax=ax, label="numpy.dot", logy=True)
einsum_dot.plot(x='size', y="average", ax=ax, logy=True,label="numpy.einsum")
ax.set_title("numpy einsum / dot dot product execution time");
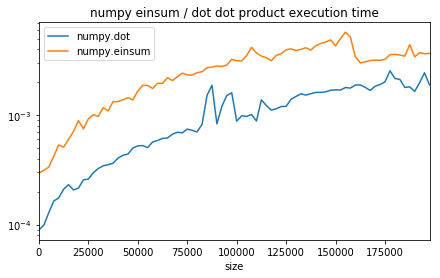
The function einsum is slower (see Einsum - Einstein summation in deep learning appears to be slower but it is usually faster when it comes to chain operations as it reduces the number of intermediate allocations to do.
pybind11
Now the custom implementation. We start with an empty function to get a sense of the cost due to to pybind11.
from cpyquickhelper.numbers.cbenchmark_dot import empty_vector_dot_product
empty_vector_dot_product(vect, vect)
0.0
def empty_c11_dot(vect):
    return empty_vector_dot_product(vect, vect)

measure_time("empty_c11_dot(values)",
             context=dict(empty_c11_dot=empty_c11_dot, values=vect), repeat=10)
{'average': 0.0001423012999993034,
 'deviation': 4.8738723576776925e-05,
 'min_exec': 0.00010429600000350092,
 'max_exec': 0.00025876499999810676,
 'repeat': 10,
 'number': 50,
 'size': 10000000}
Very small. It should not pollute our experiments.
from cpyquickhelper.numbers.cbenchmark_dot import vector_dot_product
vector_dot_product(vect, vect)
3334629.0
def c11_dot(vect):
    return vector_dot_product(vect, vect)

measure_time("c11_dot(values)",
             context=dict(c11_dot=c11_dot, values=vect), repeat=10)
{'average': 0.8533396122000013,
 'deviation': 0.24492425073976992,
 'min_exec': 0.6820375839999997,
 'max_exec': 1.2789236320000015,
 'repeat': 10,
 'number': 50,
 'size': 10000000}
res = []
for i in range(10, 200000, 2500):
    t = measure_time("c11_dot(values)", repeat=10,
                     context=dict(c11_dot=c11_dot, values=vect[:i].copy()))
    res.append(t)

import pandas
cus_dot = pandas.DataFrame(res)
cus_dot.tail()
| average | deviation | max_exec | min_exec | number | repeat | size | |
|---|---|---|---|---|---|---|---|
| 75 | 0.023365 | 0.001148 | 0.025472 | 0.021720 | 50 | 10 | 187510 |
| 76 | 0.024021 | 0.000643 | 0.025093 | 0.022678 | 50 | 10 | 190010 |
| 77 | 0.023822 | 0.001232 | 0.025876 | 0.021724 | 50 | 10 | 192510 |
| 78 | 0.023852 | 0.000867 | 0.025552 | 0.022637 | 50 | 10 | 195010 |
| 79 | 0.024870 | 0.000563 | 0.025481 | 0.023793 | 50 | 10 | 197510 |
fig, ax = plt.subplots(1, 2, figsize=(14,4))
dot.plot(x='size', y="average", ax=ax[0], label="numpy")
cus_dot.plot(x='size', y="average", ax=ax[0], label="pybind11")
dot.plot(x='size', y="average", ax=ax[1], label="numpy", logy=True)
cus_dot.plot(x='size', y="average", ax=ax[1], label="pybind11")
ax[0].set_title("numpy and custom dot product execution time");
ax[1].set_title("numpy and custom dot product execution time");
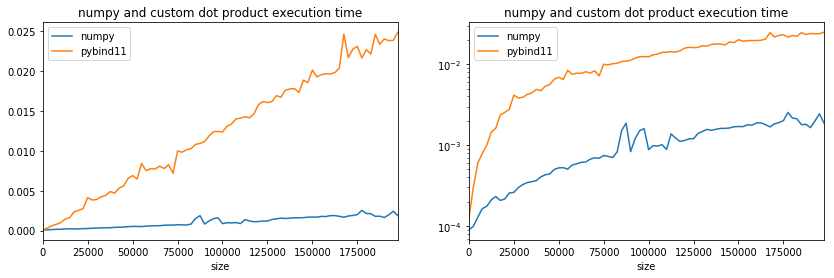
Pretty slow. Let’s see what it does to compute dot product 16 by 16.
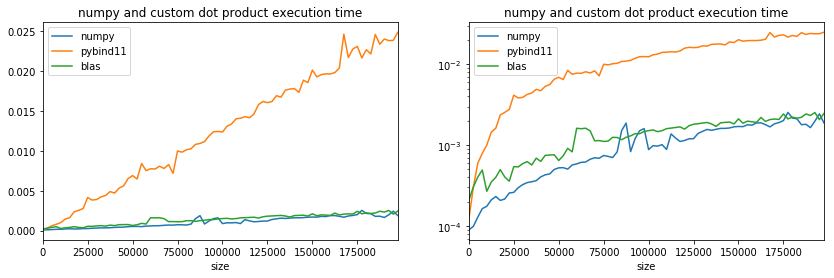
BLAS
Internally, numpy is using BLAS. A direct call to it should give the same results.
from cpyquickhelper.numbers.direct_blas_lapack import cblas_sdot

def blas_dot(vect):
    return cblas_sdot(vect, vect)

measure_time("blas_dot(values)", context=dict(blas_dot=blas_dot, values=vect), repeat=10)
{'average': 0.18376368689999795,
 'deviation': 0.013271289356658413,
 'min_exec': 0.16785606499999517,
 'max_exec': 0.20954452600000195,
 'repeat': 10,
 'number': 50,
 'size': 10000000}
res = []
for i in range(10, 200000, 2500):
    t = measure_time("blas_dot(values)", repeat=10,
                     context=dict(blas_dot=blas_dot, values=vect[:i].copy()))
    res.append(t)

import pandas
blas_dot = pandas.DataFrame(res)
blas_dot.tail()
| average | deviation | max_exec | min_exec | number | repeat | size | |
|---|---|---|---|---|---|---|---|
| 75 | 0.002430 | 0.000223 | 0.002573 | 0.001950 | 50 | 10 | 187510 |
| 76 | 0.002326 | 0.000258 | 0.002600 | 0.001931 | 50 | 10 | 190010 |
| 77 | 0.002530 | 0.000197 | 0.002635 | 0.001977 | 50 | 10 | 192510 |
| 78 | 0.002071 | 0.000440 | 0.002698 | 0.001519 | 50 | 10 | 195010 |
| 79 | 0.002458 | 0.000400 | 0.003242 | 0.001869 | 50 | 10 | 197510 |
fig, ax = plt.subplots(1, 2, figsize=(14,4))
dot.plot(x='size', y="average", ax=ax[0], label="numpy")
cus_dot.plot(x='size', y="average", ax=ax[0], label="pybind11")
blas_dot.plot(x='size', y="average", ax=ax[0], label="blas")
dot.plot(x='size', y="average", ax=ax[1], label="numpy", logy=True)
cus_dot.plot(x='size', y="average", ax=ax[1], label="pybind11")
blas_dot.plot(x='size', y="average", ax=ax[1], label="blas")
ax[0].set_title("numpy and custom dot product execution time");
ax[1].set_title("numpy and custom dot product execution time");
Use of branching: 16 multplications in one row
The code looks like what follows. If there is more than 16 multiplications left, we use function vector_dot_product_pointer16, otherwise, there are done one by one like the previous function.
# float vector_dot_product_pointer16(const float *p1, const float *p2)
# {
#     float sum = 0;
#
#     sum += *(p1++) * *(p2++);
#     sum += *(p1++) * *(p2++);
#     sum += *(p1++) * *(p2++);
#     sum += *(p1++) * *(p2++);
#     sum += *(p1++) * *(p2++);
#     sum += *(p1++) * *(p2++);
#     sum += *(p1++) * *(p2++);
#     sum += *(p1++) * *(p2++);
#
#     sum += *(p1++) * *(p2++);
#     sum += *(p1++) * *(p2++);
#     sum += *(p1++) * *(p2++);
#     sum += *(p1++) * *(p2++);
#     sum += *(p1++) * *(p2++);
#     sum += *(p1++) * *(p2++);
#     sum += *(p1++) * *(p2++);
#     sum += *(p1++) * *(p2++);
#
#     return sum;
# }
#
# #define BYN 16
#
# float vector_dot_product_pointer16(const float *p1, const float *p2, size_t size)
# {
#     float sum = 0;
#     size_t i = 0;
#     if (size >= BYN) {
#         size_t size_ = size - BYN;
#         for(; i < size_; i += BYN, p1 += BYN, p2 += BYN)
#             sum += vector_dot_product_pointer16(p1, p2);
#     }
#     for(; i < size; ++p1, ++p2, ++i)
#         sum += *p1 * *p2;
#     return sum;
# }
#
# float vector_dot_product16(py::array_t<float> v1, py::array_t<float> v2)
# {
#     if (v1.ndim() != v2.ndim())
#         throw std::runtime_error("Vector v1 and v2 must have the same dimension.");
#     if (v1.ndim() != 1)
#         throw std::runtime_error("Vector v1 and v2 must be vectors.");
#     return vector_dot_product_pointer16(v1.data(0), v2.data(0), v1.shape(0));
# }
from cpyquickhelper.numbers.cbenchmark_dot import vector_dot_product16
vector_dot_product16(vect, vect)
3333331.75
def c11_dot16(vect):
    return vector_dot_product16(vect, vect)

measure_time("c11_dot16(values)",
             context=dict(c11_dot16=c11_dot16, values=vect), repeat=10)
{'average': 0.5628858367999967,
 'deviation': 0.006558496803961198,
 'min_exec': 0.5514294899999896,
 'max_exec': 0.5766948529999922,
 'repeat': 10,
 'number': 50,
 'size': 10000000}
res = []
for i in range(10, 200000, 2500):
    t = measure_time("c11_dot16(values)", repeat=10,
                     context=dict(c11_dot16=c11_dot16, values=vect[:i].copy()))
    res.append(t)

cus_dot16 = pandas.DataFrame(res)
cus_dot16.tail()
| average | deviation | max_exec | min_exec | number | repeat | size | |
|---|---|---|---|---|---|---|---|
| 75 | 0.010757 | 0.000345 | 0.011495 | 0.010465 | 50 | 10 | 187510 |
| 76 | 0.010169 | 0.000474 | 0.011362 | 0.009392 | 50 | 10 | 190010 |
| 77 | 0.010440 | 0.000449 | 0.011532 | 0.010153 | 50 | 10 | 192510 |
| 78 | 0.011015 | 0.000679 | 0.011867 | 0.009231 | 50 | 10 | 195010 |
| 79 | 0.011091 | 0.000540 | 0.012168 | 0.010415 | 50 | 10 | 197510 |
fig, ax = plt.subplots(1, 2, figsize=(14,4))
dot.plot(x='size', y="average", ax=ax[0], label="numpy")
cus_dot.plot(x='size', y="average", ax=ax[0], label="pybind11")
cus_dot16.plot(x='size', y="average", ax=ax[0], label="pybind11x16")
dot.plot(x='size', y="average", ax=ax[1], label="numpy", logy=True)
cus_dot.plot(x='size', y="average", ax=ax[1], label="pybind11")
cus_dot16.plot(x='size', y="average", ax=ax[1], label="pybind11x16")
ax[0].set_title("numpy and custom dot product execution time");
ax[1].set_title("numpy and custom dot product execution time");
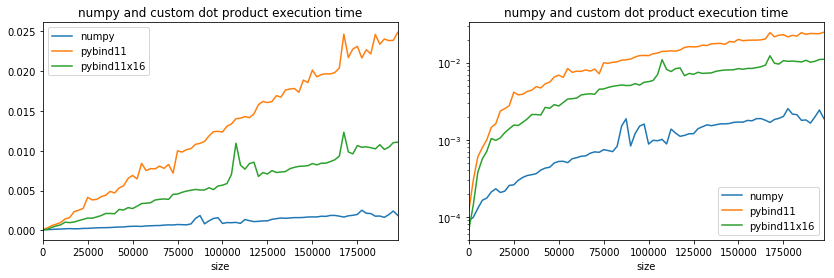
We are far from numpy but the branching has clearly a huge impact and the fact the loop condition is evaluated only every 16 iterations does not explain this gain. Next experiment with SSE instructions.
Optimized to remove function call
We remove the function call to get the following version.
# float vector_dot_product_pointer16_nofcall(const float *p1, const float *p2, size_t size)
# {
#     float sum = 0;
#     const float * end = p1 + size;
#     if (size >= BYN) {
#         #if(BYN != 16)
#             #error "BYN must be equal to 16";
#         #endif
#         unsigned int size_ = (unsigned int) size;
#         size_ = size_ >> 4;  // division by 16=2^4
#         size_ = size_ << 4;  // multiplication by 16=2^4
#         const float * end_ = p1 + size_;
#         for(; p1 != end_;)
#         {
#             sum += *p1 * *p2; ++p1, ++p2;
#             sum += *p1 * *p2; ++p1, ++p2;
#             sum += *p1 * *p2; ++p1, ++p2;
#             sum += *p1 * *p2; ++p1, ++p2;
#
#             sum += *p1 * *p2; ++p1, ++p2;
#             sum += *p1 * *p2; ++p1, ++p2;
#             sum += *p1 * *p2; ++p1, ++p2;
#             sum += *p1 * *p2; ++p1, ++p2;
#
#             sum += *p1 * *p2; ++p1, ++p2;
#             sum += *p1 * *p2; ++p1, ++p2;
#             sum += *p1 * *p2; ++p1, ++p2;
#             sum += *p1 * *p2; ++p1, ++p2;
#
#             sum += *p1 * *p2; ++p1, ++p2;
#             sum += *p1 * *p2; ++p1, ++p2;
#             sum += *p1 * *p2; ++p1, ++p2;
#             sum += *p1 * *p2; ++p1, ++p2;
#         }
#     }
#     for(; p1 != end; ++p1, ++p2)
#         sum += *p1 * *p2;
#     return sum;
# }
#
# float vector_dot_product16_nofcall(py::array_t<float> v1, py::array_t<float> v2)
# {
#     if (v1.ndim() != v2.ndim())
#         throw std::runtime_error("Vector v1 and v2 must have the same dimension.");
#     if (v1.ndim() != 1)
#         throw std::runtime_error("Vector v1 and v2 must be vectors.");
#     return vector_dot_product_pointer16_nofcall(v1.data(0), v2.data(0), v1.shape(0));
# }
from cpyquickhelper.numbers.cbenchmark_dot import vector_dot_product16_nofcall
vector_dot_product16_nofcall(vect, vect)
3334629.0
def c11_dot16_nofcall(vect):
    return vector_dot_product16_nofcall(vect, vect)

measure_time("c11_dot16_nofcall(values)",
             context=dict(c11_dot16_nofcall=c11_dot16_nofcall, values=vect), repeat=10)
{'average': 1.2945859600000034,
 'deviation': 0.029453146426095998,
 'min_exec': 1.270528181000003,
 'max_exec': 1.3768783189999851,
 'repeat': 10,
 'number': 50,
 'size': 10000000}
res = []
for i in range(10, 200000, 2500):
    t = measure_time("c11_dot16_nofcall(values)", repeat=10,
                     context=dict(c11_dot16_nofcall=c11_dot16_nofcall, values=vect[:i].copy()))
    res.append(t)

cus_dot16_nofcall = pandas.DataFrame(res)
cus_dot16_nofcall.tail()
| average | deviation | max_exec | min_exec | number | repeat | size | |
|---|---|---|---|---|---|---|---|
| 75 | 0.023715 | 0.001017 | 0.025011 | 0.021424 | 50 | 10 | 187510 |
| 76 | 0.024223 | 0.000463 | 0.024711 | 0.023164 | 50 | 10 | 190010 |
| 77 | 0.024831 | 0.000362 | 0.025402 | 0.024273 | 50 | 10 | 192510 |
| 78 | 0.025039 | 0.000294 | 0.025515 | 0.024486 | 50 | 10 | 195010 |
| 79 | 0.026592 | 0.001819 | 0.031072 | 0.024430 | 50 | 10 | 197510 |
fig, ax = plt.subplots(1, 2, figsize=(14,4))
dot.plot(x='size', y="average", ax=ax[0], label="numpy")
cus_dot.plot(x='size', y="average", ax=ax[0], label="pybind11")
cus_dot16.plot(x='size', y="average", ax=ax[0], label="pybind11x16")
cus_dot16_nofcall.plot(x='size', y="average", ax=ax[0], label="pybind11x16_nofcall")
dot.plot(x='size', y="average", ax=ax[1], label="numpy", logy=True)
cus_dot.plot(x='size', y="average", ax=ax[1], label="pybind11")
cus_dot16.plot(x='size', y="average", ax=ax[1], label="pybind11x16")
cus_dot16_nofcall.plot(x='size', y="average", ax=ax[1], label="pybind11x16_nofcall")
ax[0].set_title("numpy and custom dot product execution time");
ax[1].set_title("numpy and custom dot product execution time");

Weird, branching did not happen when the code is not inside a separate function.
SSE instructions
We replace one function in the previous implementation.
# #include <xmmintrin.h>
#
# float vector_dot_product_pointer16_sse(const float *p1, const float *p2)
# {
#     __m128 c1 = _mm_load_ps(p1);
#     __m128 c2 = _mm_load_ps(p2);
#     __m128 r1 = _mm_mul_ps(c1, c2);
#
#     p1 += 4;
#     p2 += 4;
#
#     c1 = _mm_load_ps(p1);
#     c2 = _mm_load_ps(p2);
#     r1 = _mm_add_ps(r1, _mm_mul_ps(c1, c2));
#
#     p1 += 4;
#     p2 += 4;
#
#     c1 = _mm_load_ps(p1);
#     c2 = _mm_load_ps(p2);
#     r1 = _mm_add_ps(r1, _mm_mul_ps(c1, c2));
#
#     p1 += 4;
#     p2 += 4;
#
#     c1 = _mm_load_ps(p1);
#     c2 = _mm_load_ps(p2);
#     r1 = _mm_add_ps(r1, _mm_mul_ps(c1, c2));
#
#     float r[4];
#     _mm_store_ps(r, r1);
#
#     return r[0] + r[1] + r[2] + r[3];
# }
from cpyquickhelper.numbers.cbenchmark_dot import vector_dot_product16_sse
vector_dot_product16_sse(vect, vect)
3333332.0
def c11_dot16_sse(vect):
    return vector_dot_product16_sse(vect, vect)

measure_time("c11_dot16_sse(values)",
             context=dict(c11_dot16_sse=c11_dot16_sse, values=vect), repeat=10)
{'average': 0.22386672670000393,
 'deviation': 0.004340312827217225,
 'min_exec': 0.21708269199999108,
 'max_exec': 0.23220287799998118,
 'repeat': 10,
 'number': 50,
 'size': 10000000}
res = []
for i in range(10, 200000, 2500):
    t = measure_time("c11_dot16_sse(values)", repeat=10,
                     context=dict(c11_dot16_sse=c11_dot16_sse, values=vect[:i].copy()))
    res.append(t)

cus_dot16_sse = pandas.DataFrame(res)
cus_dot16_sse.tail()
| average | deviation | max_exec | min_exec | number | repeat | size | |
|---|---|---|---|---|---|---|---|
| 75 | 0.003629 | 0.000200 | 0.003825 | 0.003051 | 50 | 10 | 187510 |
| 76 | 0.003571 | 0.000230 | 0.003793 | 0.003063 | 50 | 10 | 190010 |
| 77 | 0.003642 | 0.000267 | 0.003821 | 0.003110 | 50 | 10 | 192510 |
| 78 | 0.003583 | 0.000285 | 0.003846 | 0.003146 | 50 | 10 | 195010 |
| 79 | 0.004467 | 0.000770 | 0.005784 | 0.003754 | 50 | 10 | 197510 |
fig, ax = plt.subplots(1, 2, figsize=(14,4))
dot.plot(x='size', y="average", ax=ax[0], label="numpy")
cus_dot16_sse.plot(x='size', y="average", ax=ax[0], label="pybind11x16_sse")
dot.plot(x='size', y="average", ax=ax[1], label="numpy", logy=True)
cus_dot16_sse.plot(x='size', y="average", ax=ax[1], label="pybind11x16_sse")
cus_dot.plot(x='size', y="average", ax=ax[1], label="pybind11")
cus_dot16.plot(x='size', y="average", ax=ax[1], label="pybind11x16")
ax[0].set_title("numpy and custom dot product execution time");
ax[1].set_title("numpy and custom dot product execution time");
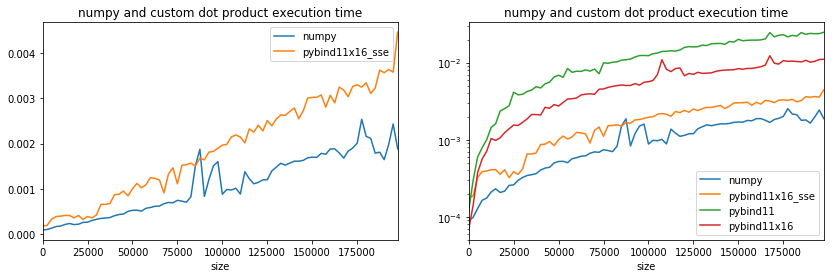
Better even though it is still slower than numpy. It is closer. Maybe the compilation option are not optimized, numpy was also compiled with the Intel compiler. To be accurate, multi-threading must be disabled on numpy side. That’s the purpose of the first two lines.
AVX 512
Last experiment with AVX 512 instructions but it does not work on all processor. I could not test it on my laptop as these instructions do not seem to be available. More can be found on wikipedia CPUs with AVX-512.
import platform
platform.processor()
'Intel64 Family 6 Model 78 Stepping 3, GenuineIntel'
import numpy
values = numpy.array(list(range(10000000)), dtype=numpy.float32)
vect = values / numpy.max(values)
from cpyquickhelper.numbers.cbenchmark_dot import vector_dot_product16_avx512
vector_dot_product16_avx512(vect, vect)
3333332.0
def c11_dot16_avx512(vect):
    return vector_dot_product16_avx512(vect, vect)

measure_time("c11_dot16_avx512(values)",
             context=dict(c11_dot16_avx512=c11_dot16_avx512, values=vect), repeat=10)
{'average': 0.24621207209999624,
 'deviation': 0.030678971301695272,
 'min_exec': 0.21640002699999172,
 'max_exec': 0.3037627230000055,
 'repeat': 10,
 'number': 50,
 'size': 10000000}
res = []
for i in range(10, 200000, 2500):
    t = measure_time("c11_dot16_avx512(values)", repeat=10,
                     context=dict(c11_dot16_avx512=c11_dot16_avx512, values=vect[:i].copy()))
    res.append(t)

cus_dot16_avx512 = pandas.DataFrame(res)
cus_dot16_avx512.tail()
| average | deviation | max_exec | min_exec | number | repeat | size | |
|---|---|---|---|---|---|---|---|
| 75 | 0.003631 | 0.001094 | 0.005245 | 0.001953 | 50 | 10 | 187510 |
| 76 | 0.004108 | 0.001309 | 0.006254 | 0.002541 | 50 | 10 | 190010 |
| 77 | 0.003714 | 0.000933 | 0.005624 | 0.002511 | 50 | 10 | 192510 |
| 78 | 0.005389 | 0.001072 | 0.007044 | 0.003420 | 50 | 10 | 195010 |
| 79 | 0.005102 | 0.001096 | 0.008251 | 0.004557 | 50 | 10 | 197510 |
fig, ax = plt.subplots(1, 2, figsize=(14,4))
dot.plot(x='size', y="average", ax=ax[0], label="numpy")
cus_dot16.plot(x='size', y="average", ax=ax[0], label="pybind11x16")
cus_dot16_sse.plot(x='size', y="average", ax=ax[0], label="pybind11x16_sse")
cus_dot16_avx512.plot(x='size', y="average", ax=ax[0], label="pybind11x16_avx512")
dot.plot(x='size', y="average", ax=ax[1], label="numpy", logy=True)
cus_dot16.plot(x='size', y="average", ax=ax[1], label="pybind11x16")
cus_dot16_sse.plot(x='size', y="average", ax=ax[1], label="pybind11x16_sse")
cus_dot16_avx512.plot(x='size', y="average", ax=ax[1], label="pybind11x16_avx512")
cus_dot.plot(x='size', y="average", ax=ax[1], label="pybind11")
ax[0].set_title("numpy and custom dot product execution time");
ax[1].set_title("numpy and custom dot product execution time");
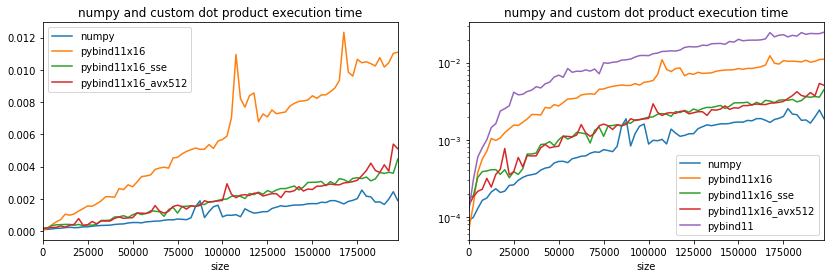
If the time is the same, it means that options AVX512 are not available.
from cpyquickhelper.numbers.cbenchmark import get_simd_available_option
get_simd_available_option()
'Available options: __SSE__ __SSE2__ __SSE3__ __SSE4_1__'
Last call with OpenMP
from cpyquickhelper.numbers.cbenchmark_dot import vector_dot_product_openmp
vector_dot_product_openmp(vect, vect, 2)
3348343.25
vector_dot_product_openmp(vect, vect, 4)
3343080.75
def c11_dot_openmp2(vect):
    return vector_dot_product_openmp(vect, vect, nthreads=2)

def c11_dot_openmp4(vect):
    return vector_dot_product_openmp(vect, vect, nthreads=4)

measure_time("c11_dot_openmp2(values)",
             context=dict(c11_dot_openmp2=c11_dot_openmp2, values=vect), repeat=10)
{'average': 0.6101010486999939,
 'deviation': 0.023996900833560427,
 'min_exec': 0.5678723409999975,
 'max_exec': 0.6511117819999299,
 'repeat': 10,
 'number': 50,
 'size': 10000000}
measure_time("c11_dot_openmp4(values)",
             context=dict(c11_dot_openmp4=c11_dot_openmp4, values=vect), repeat=10)
{'average': 0.329937042999984,
 'deviation': 0.016537939361682446,
 'min_exec': 0.30559936400004517,
 'max_exec': 0.35731013800000255,
 'repeat': 10,
 'number': 50,
 'size': 10000000}
res = []
for i in range(10, 200000, 2500):
    t = measure_time("c11_dot_openmp2(values)", repeat=10,
                     context=dict(c11_dot_openmp2=c11_dot_openmp2, values=vect[:i].copy()))
    res.append(t)

cus_dot_openmp2 = pandas.DataFrame(res)
cus_dot_openmp2.tail()
| average | deviation | max_exec | min_exec | number | repeat | size | |
|---|---|---|---|---|---|---|---|
| 75 | 0.011458 | 0.000959 | 0.012970 | 0.010097 | 50 | 10 | 187510 |
| 76 | 0.011582 | 0.000723 | 0.012886 | 0.010232 | 50 | 10 | 190010 |
| 77 | 0.012416 | 0.000774 | 0.013324 | 0.011078 | 50 | 10 | 192510 |
| 78 | 0.013305 | 0.000465 | 0.013685 | 0.012125 | 50 | 10 | 195010 |
| 79 | 0.009506 | 0.001906 | 0.012279 | 0.007230 | 50 | 10 | 197510 |
res = []
for i in range(10, 200000, 2500):
    t = measure_time("c11_dot_openmp4(values)", repeat=10,
                     context=dict(c11_dot_openmp4=c11_dot_openmp4, values=vect[:i].copy()))
    res.append(t)

cus_dot_openmp4 = pandas.DataFrame(res)
cus_dot_openmp4.tail()
| average | deviation | max_exec | min_exec | number | repeat | size | |
|---|---|---|---|---|---|---|---|
| 75 | 0.006757 | 0.000376 | 0.007589 | 0.006341 | 50 | 10 | 187510 |
| 76 | 0.007416 | 0.001347 | 0.011127 | 0.006291 | 50 | 10 | 190010 |
| 77 | 0.006946 | 0.000783 | 0.008544 | 0.005562 | 50 | 10 | 192510 |
| 78 | 0.006466 | 0.000636 | 0.007366 | 0.005439 | 50 | 10 | 195010 |
| 79 | 0.006986 | 0.000389 | 0.007906 | 0.006533 | 50 | 10 | 197510 |
fig, ax = plt.subplots(1, 2, figsize=(14,4))
dot.plot(x='size', y="average", ax=ax[0], label="numpy")
cus_dot16.plot(x='size', y="average", ax=ax[0], label="pybind11x16")
cus_dot16_sse.plot(x='size', y="average", ax=ax[0], label="pybind11x16_sse")
cus_dot_openmp2.plot(x='size', y="average", ax=ax[0], label="cus_dot_openmp2")
cus_dot_openmp4.plot(x='size', y="average", ax=ax[0], label="cus_dot_openmp4")
dot.plot(x='size', y="average", ax=ax[1], label="numpy", logy=True)
cus_dot16.plot(x='size', y="average", ax=ax[1], label="pybind11x16")
cus_dot16_sse.plot(x='size', y="average", ax=ax[1], label="pybind11x16_sse")
cus_dot_openmp2.plot(x='size', y="average", ax=ax[1], label="cus_dot_openmp2")
cus_dot_openmp4.plot(x='size', y="average", ax=ax[1], label="cus_dot_openmp4")
cus_dot.plot(x='size', y="average", ax=ax[1], label="pybind11")
ax[0].set_title("numpy and custom dot product execution time");
ax[1].set_title("numpy and custom dot product execution time");
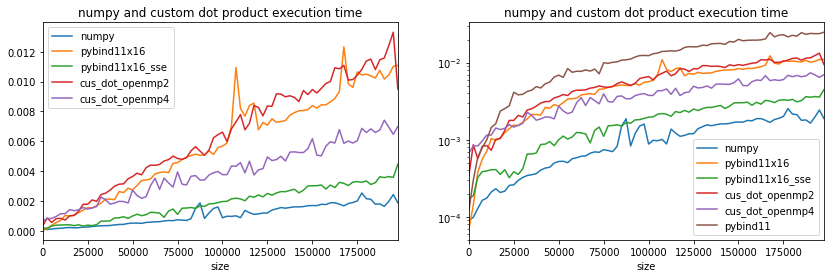
Parallelization does not solve everything, efficient is important.
Back to numpy
This article Why is matrix multiplication faster with numpy than with ctypes in Python? gives some kints on why numpy is still faster. By looking at the code of the dot product in numpy: arraytypes.c.src, it seems that numpy does a simple dot product without using branching or uses the library BLAS which is the case in this benchmark (code for dot product: sdot.c). And it does use branching. See also function blas_stride. These libraries then play with compilation options and optimize for speed. This benchmark does not look into cython-blis which implements some BLAS functions with an assembly language and has different implementations depending on the platform it is used. A little bit more on C++ optimization How to optimize C and C++ code in 2018.
