1A.1 - Tracer une pyramide bigarrée - correction#
Links: notebook, html, python, slides, GitHub
Cet exercice est inspirée de l’article 2015-04-07 Motif, optimisation, biodiversité. Il s’agit de dessiner un motif. Correction.
from jyquickhelper import add_notebook_menu
add_notebook_menu()
%matplotlib inline
Problème#
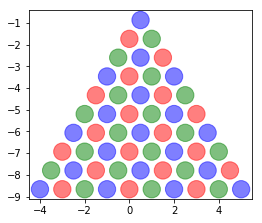
Il s’agit de dessiner la pyramide suivante à l’aide de matplotlib.
from IPython.display import Image
Image("http://www.xavierdupre.fr/app/code_beatrix/helpsphinx/_images/biodiversite_tri2.png")

Idée de la solution#
On sépare le problème en deux plus petits :
Trouver la position des boules dans un repère cartésien.
Choisir la bonne couleur.
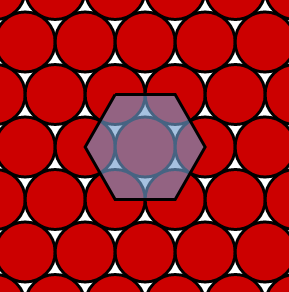
Le repère est hexagonal. L’image suivante est tirée de la page wikipédia empilement compact.
from pyquickhelper.helpgen import NbImage
NbImage("data/hexa.png")
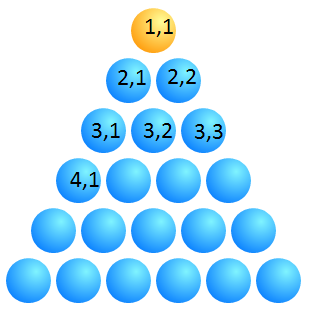
Mais dans un premier temps, il faut un moyen de repérer chaque boule. On les numérote avec deux indices.
Image("http://www.xavierdupre.fr/app/code_beatrix/helpsphinx/_images/pyramide_num2.png")
Les coordonnées#
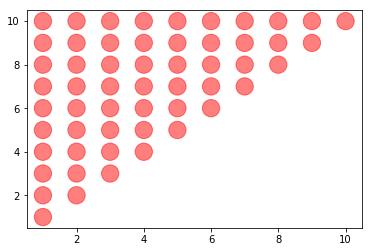
On prend comme exemple scatter_demo.py sur le site de matplotlib.
import matplotlib.pyplot as plt

fig, ax = plt.subplots(1,1)
n = 10
x = []
y = []
for i in range(1,n+1):
    for j in range(i, n+1):
        x.append(i)
        y.append(j)
size = [300 for c in x]
colors = ["r" for c in x]
ax.scatter(x, y, s=size, c=colors, alpha=0.5)
<matplotlib.collections.PathCollection at 0x193713b3b00>
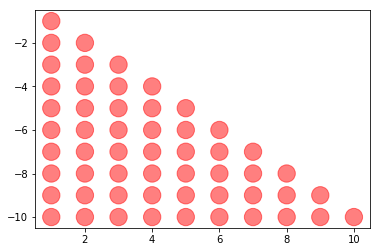
On inverse.
fig, ax = plt.subplots(1,1)
n = 10
x = []
y = []
for i in range(1,n+1):
    for j in range(i, n+1):
        x.append(i)
        y.append(-j)
size = [300 for c in x]
colors = ["r" for c in x]
ax.scatter(x, y, s=size, c=colors, alpha=0.5)
<matplotlib.collections.PathCollection at 0x193714d31d0>
On décale.
fig, ax = plt.subplots(1,1)
n = 10
x = []
y = []
for i in range(1,n+1):
    for j in range(i, n+1):
        x.append(i - j*0.5)
        y.append(-j)
size = [300 for c in x]
colors = ["r" for c in x]
ax.scatter(x, y, s=size, c=colors, alpha=0.5)
<matplotlib.collections.PathCollection at 0x1937155acc0>
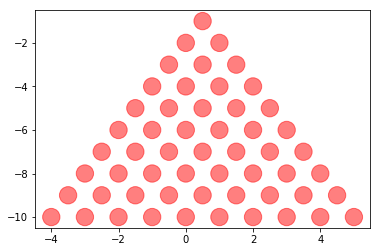
Cela ressemble à de l’hexagonal mais ce n’est pas encore tout à fait
cela. La hauteur d’un triangle équilatéral de côté un est
 . Ca tombe bien car dans l’exemple précédente,
le côté de chaque triangle est 1. Et on change la dimension du graphe
tracé avec matplotlib pour éviter de réduire nos effort à néant.
. Ca tombe bien car dans l’exemple précédente,
le côté de chaque triangle est 1. Et on change la dimension du graphe
tracé avec matplotlib pour éviter de réduire nos effort à néant.
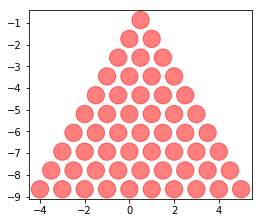
fig, ax = plt.subplots(1,1, figsize=(4, 4*(3**0.5)/2))
n = 10
x = []
y = []
for i in range(1,n+1):
    for j in range(i, n+1):
        x.append(i - j*0.5)
        y.append(-j*(3**0.5)/2)
size = [300 for c in x]
colors = ["r" for c in x]
ax.scatter(x, y, s=size, c=colors, alpha=0.5)
<matplotlib.collections.PathCollection at 0x193718effd0>
La couleur#
Je vous laisse retourner sur les deux premières images et observer la
couleur de toutes les boules qui vérifient (i+j)%3 == 1.
fig, ax = plt.subplots(1,1, figsize=(4, 4*(3**0.5)/2))
n = 10
x = []
y = []
colors = []
trois = "rgb"
for i in range(1,n+1):
    for j in range(i, n+1):
        x.append(i - j*0.5)
        y.append(-j*(3**0.5)/2)
        colors.append(trois[(i+j) % 3])
size = [300 for c in x]
ax.scatter(x, y, s=size, c=colors, alpha=0.5)
<matplotlib.collections.PathCollection at 0x1937198f6d8>