lifelines#
Links: notebook, html, PDF, python, slides, GitHub
lifelines implements methods and algorithm for life insurance. As many dedicated module, it contains custom graphs built on the top of matplotlib for this module.
documentation source installation tutorial
from jyquickhelper import add_notebook_menu
add_notebook_menu()
%matplotlib inline
import matplotlib.pyplot as plt
plt.style.use('ggplot')
example#
from lifelines.plotting import plot_lifetimes
from numpy.random import uniform, exponential
from numpy import array, minimum
import matplotlib.pyplot as plt
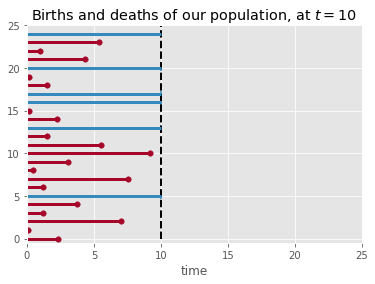
N = 25
current_time = 10
actual_lifetimes = array([[exponential(12), exponential(2)][uniform()<0.5] for i in range(N)])
observed_lifetimes = minimum(actual_lifetimes,current_time)
observed = actual_lifetimes < current_time
plt.xlim(0,25)
plt.vlines(10,0,30,lw=2, linestyles="--")
plt.xlabel('time')
plt.title('Births and deaths of our population, at $t=10$')
plot_lifetimes(observed_lifetimes, event_observed=observed)
print("Observed lifetimes at time %d:\n"%(current_time), observed_lifetimes)
Observed lifetimes at time 10:
 [ 10.           5.39173892   0.96070227   4.30409009  10.           0.16092116
   1.51180601  10.          10.           0.13168284   2.24095861  10.
   1.48363817   5.53642893   9.16920642   3.04028587   0.42805536
   7.51075415   1.18884195  10.           3.72807581   1.18750325
   7.0485026    0.08488696   2.29143555]
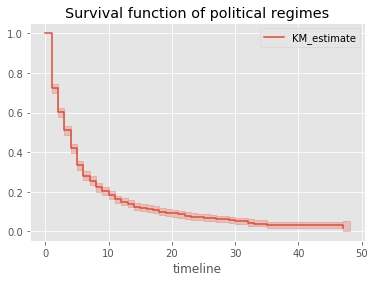
import lifelines.datasets
from lifelines import KaplanMeierFitter
kmf = KaplanMeierFitter()

data = lifelines.datasets.load_dd()
T = data["duration"]
C = data["observed"]
kmf.fit(T, event_observed=C )

kmf.plot()
plt.title('Survival function of political regimes')
Text(0.5,1,'Survival function of political regimes')