matplotlib#
Links: notebook, html, PDF, python, slides, GitHub
matplotlib is the most used to plot. It is the reference.
Every plotting library works the same way:
We define axis (they boundaries can be adjusted based on the data)
We add curves, points, surfaces (A).
We add legendes (B).
We convert the plot into an image.
Step (A) and (B) can be repeated in any order. Curves and legends superimposed.
documentation source installation tutorial gallery
%matplotlib inline
from jyquickhelper import add_notebook_menu
add_notebook_menu()
Setup#
Some parts of matplotlib are written in C and needs to be compiled.
Thus the instruction pip install matplotlib usually fails on Windows
unless Visual Studio 2015 Community
Edition
is installed. I recommend to use a precompiled version through
conda install matplotlib or Unofficial Windows Binaries for Python
Extension Packages sous
Windows.
import matplotlib.pyplot as plt
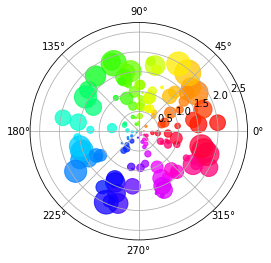
First example#
import numpy as np
import matplotlib.pyplot as plt

N = 150
r = 2 * np.random.rand(N)
theta = 2 * np.pi * np.random.rand(N)
area = 200 * r**2 * np.random.rand(N)
colors = theta

ax = plt.subplot(111, projection='polar')
c = plt.scatter(theta, r, c=colors, s=area, cmap=plt.cm.hsv)
c.set_alpha(0.75)
Animation#
To make it work:
On Windows, open file
matplotlibrcand update parameteranimation.ffmpeg_path. On Linux, the same must be done for avconv.
import matplotlib
matplotlib.matplotlib_fname()
'c:\Python36_x64\lib\site-packages\matplotlib\mpl-data\matplotlibrc'
import os
matplotlib.rcParams['animation.ffmpeg_path'].replace(os.environ.get("USERPROFILE", "~"), "<user>")
'<user>\ffmpeg-20170821-d826951-win64-static\bin\ffmpeg.exe'
import matplotlib.animation
matplotlib.animation.writers.list()
['ffmpeg', 'ffmpeg_file']
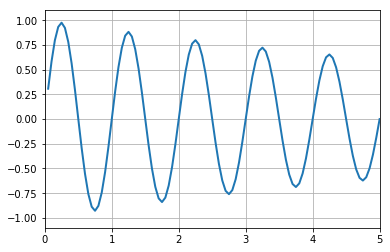
Let’s take an example from matplotlib documentation bayes_update.
import numpy as np
import matplotlib.pyplot as plt
import matplotlib.animation as animation

def data_gen():
    t = data_gen.t
    cnt = 0
    while cnt < 1000:
        cnt+=1
        t += 0.05
        yield t, np.sin(2*np.pi*t) * np.exp(-t/10.)
data_gen.t = 0

fig, ax = plt.subplots()
line, = ax.plot([], [], lw=2)
ax.set_ylim(-1.1, 1.1)
ax.set_xlim(0, 5)
ax.grid()
xdata, ydata = [], []
def run(data):
    # update the data
    t,y = data
    xdata.append(t)
    ydata.append(y)
    xmin, xmax = ax.get_xlim()

    if t >= xmax:
        ax.set_xlim(xmin, 2*xmax)
        ax.figure.canvas.draw()
    line.set_data(xdata, ydata)

    return line,

anim = animation.FuncAnimation(fig, run, data_gen, blit=True, interval=10, repeat=False)

# saves the video
from matplotlib.animation import writers
Writer = writers['ffmpeg']
writer = Writer(fps=15, metadata=dict(artist='Me'), bitrate=1800)
anim.save('lines2.mp4', writer=writer)
import os
[_ for _ in os.listdir(".") if "mp4" in _]
['lines2.mp4']
Open question : how to display the video in the notebook?
Interactions#
Interaction can be done with the regular GUI. See poly_editor.py.
Use javascript!