mpl-scatter-density#
Links: notebook, html, PDF, python, slides, GitHub
mpl-scatter-density speeds up density graph. matplotlib is very slow when it comes to draw millions of points. datashader is one alternative but was meant for zooming/dezooming. This package provides a simple functionality. The example comes the documentation.
%matplotlib inline
from jyquickhelper import add_notebook_menu
add_notebook_menu()
example#
import numpy as np
import mpl_scatter_density
import matplotlib.pyplot as plt
import matplotlib.colors as col

# Generate fake data

N = 10000000
x = np.random.normal(4, 2, N)
y = np.random.normal(3, 1, N)

# Make the plot - note that for the projection option to work, the
# mpl_scatter_density module has to be imported above.

fig = plt.figure()
ax = fig.add_subplot(1, 1, 1, projection='scatter_density')
try:
    ax.scatter_density(x, y)
    ax.set_xlim(-5, 10)
    ax.set_ylim(-5, 10)
except AttributeError as e:
    print('issue with more recent version')
    print(e)
issue with more recent version
'NoneType' object has no attribute 'vmin'
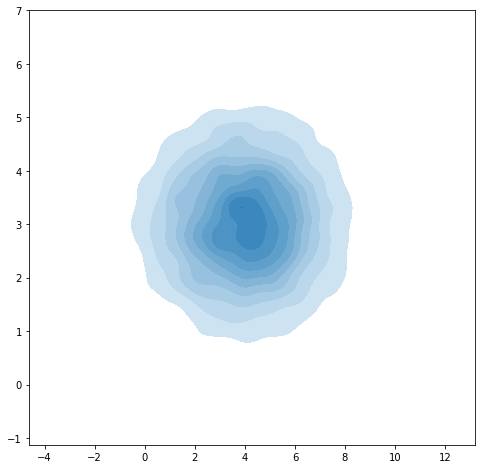
The corresponding matplotib function does not exist as is. The module seaborn provides density visualization but it is not designed for such big sample.
import numpy as np
import seaborn as sns
import matplotlib.pyplot as plt

# Generate fake data

N = 10000
x = np.random.normal(4, 2, N)
y = np.random.normal(3, 1, N)

#import seaborn as sns
import matplotlib.pyplot as plt
f, ax = plt.subplots(figsize=(8, 8))

ax = sns.kdeplot(x, y, shade=True, shade_lowest=False)
c:python372_x64libsite-packagesstatsmodelstools_testing.py:19: FutureWarning: pandas.util.testing is deprecated. Use the functions in the public API at pandas.testing instead.
  import pandas.util.testing as tm