seaborn#
Links: notebook, html, PDF, python, slides, GitHub
seaborn is an extension of matplotlib for statisticians. Graphs are really nice and famous among statisticians. However, it is difficult to draw a graph with weighted observations.
documentation source installation tutorial gallerie
%matplotlib inline
from jyquickhelper import add_notebook_menu
add_notebook_menu()
example#
import numpy
import seaborn
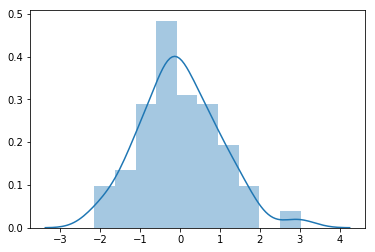
x = numpy.random.normal(size=100)
seaborn.distplot(x)
<matplotlib.axes._subplots.AxesSubplot at 0x1ff5f526550>
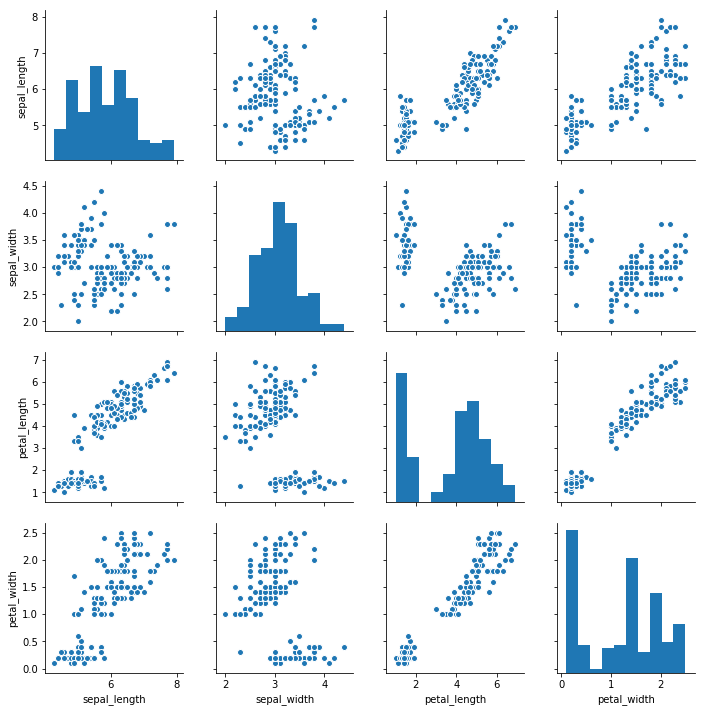
iris = seaborn.load_dataset("iris")
seaborn.pairplot(iris)
<seaborn.axisgrid.PairGrid at 0x1ff5cde6748>