plotly#
Links: notebook, html, PDF, python, slides, GitHub
plotly became open source - it was not at the beginning -, it proposes a large gallery of javascript graphs. plotly also offers to host dashboards built with plotly.
The first script usually returns an exception:
PlotlyLocalCredentialsError: Couldn’t find a ‘username’, ‘api-key’ pair for you on your local machine. To sign in temporarily (until you stop running Python), run: >>> import plotly.plotly as py >>> py.sign_in(‘username’, ‘api_key’)
Even better, save your credentials permanently using the ‘tools’ module: >>> import plotly.tools as tls >>> tls.set_credentials_file(username=’username’, api_key=’api-key’)
For more help, see https://plot.ly/python.
But there exists an offline mode.
documentation source installation tutorial gallerie
Autres liens : styles de texte en python ou styles de text en javascript
from jyquickhelper import add_notebook_menu
add_notebook_menu()
Enable plotly in a notebook#
# import cufflinks  # does not seem to be needed anymore
# import chart_studio.plotly as py
from plotly.offline import init_notebook_mode
init_notebook_mode(connected=True)
Example from the documentation#
import plotly.offline as py  # replace plotly.plotly by plotly.offline
import plotly.graph_objs as go

# Create random data with numpy
import numpy as np

N = 1000
random_x = np.random.randn(N)
random_y = np.random.randn(N)

# Create a trace
trace = go.Scatter(
    x = random_x,
    y = random_y,
    mode = 'markers'
)

data = [trace]

# Plot and embed in ipython notebook!
py.iplot(data, filename='basic-scatter')
pandas and plotly#
from sklearn.datasets import load_iris
import pandas
data = load_iris()
df = pandas.DataFrame(data["data"])
df.head()
| 0 | 1 | 2 | 3 | |
|---|---|---|---|---|
| 0 | 5.1 | 3.5 | 1.4 | 0.2 |
| 1 | 4.9 | 3.0 | 1.4 | 0.2 |
| 2 | 4.7 | 3.2 | 1.3 | 0.2 |
| 3 | 4.6 | 3.1 | 1.5 | 0.2 |
| 4 | 5.0 | 3.6 | 1.4 | 0.2 |
# cufflinks.go_offline()  # to draw within the notebook
# df.iplot() # issue with PlotlyLocalCredentialsError
from matplotlib to plotly#
%matplotlib inline
import numpy as np
import matplotlib.pyplot as plt
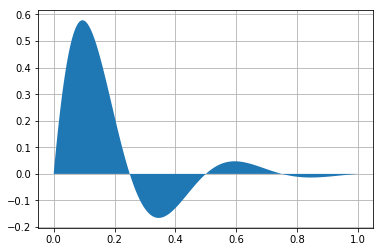
x = np.linspace(0, 1, 500)
y = np.sin(4 * np.pi * x) * np.exp(-5 * x)
fig, ax = plt.subplots()
ax.fill(x, y, zorder=10)
ax.grid(True, zorder=5);
# convert one figure matplotlib en plotly, not fully working
# from IPython.display import HTML
# print(py.plot_mpl(fig, output_type="div"))