Note
Click here to download the full example code
Benchmark inference for a linear regression#
This short code compares the execution of a couple of runtime for inference including onnxruntime. This benchmark leverages the example Benchmark Linear Regression. This simple model is useful to measure unsignificant cost for large models.
Linear Regression#
import warnings
from time import perf_counter as time
from multiprocessing import cpu_count
import numpy
from numpy.random import rand
from numpy.testing import assert_almost_equal
import matplotlib.pyplot as plt
import pandas
from onnxruntime import InferenceSession
from onnxruntime.capi._pybind_state import (  # pylint: disable=E0611
    SessionIOBinding, OrtDevice as C_OrtDevice)
from sklearn import config_context
from sklearn.linear_model import LinearRegression
from sklearn.utils._testing import ignore_warnings
from skl2onnx import to_onnx
from skl2onnx.common.data_types import FloatTensorType
from mlprodict.onnxrt import OnnxInference
Available optimisation on this machine.
from mlprodict.testing.experimental_c_impl.experimental_c import code_optimisation
print(code_optimisation())
AVX-omp=8
Implementations to benchmark#
def fcts_model(X, y, n_jobs):
    "LinearRegression."
    model = LinearRegression(n_jobs=n_jobs)
    model.fit(X, y)

    initial_types = [('X', FloatTensorType([None, X.shape[1]]))]
    onx = to_onnx(model, initial_types=initial_types,
                  black_op={'LinearRegressor'})
    sess = InferenceSession(onx.SerializeToString(),
                            providers=['CPUExecutionProvider'])
    outputs = [o.name for o in sess.get_outputs()]
    oinf = OnnxInference(onx, runtime="python")
    bind = SessionIOBinding(sess._sess)
    # ort_device = C_OrtDevice.cpu()
    ort_device = C_OrtDevice(
        C_OrtDevice.cpu(), C_OrtDevice.default_memory(), 0)

    def predict_skl_predict(X, model=model):
        return model.predict(X)

    def predict_onnxrt_predict(X, sess=sess):
        return sess.run(outputs[:1], {'X': X})[0]

    def predict_onnx_inference(X, oinf=oinf):
        return oinf.run({'X': X})["variable"]

    def predict_onnxrt_predict_bind(X, sess=sess, bind=bind,
                                    ort_device=ort_device):
        if X.__array_interface__['strides'] is not None:
            raise RuntimeError("onnxruntime only supports contiguous arrays.")
        bind.bind_input('X', ort_device, X.dtype, X.shape,
                        X.__array_interface__['data'][0])
        bind.bind_output('variable', ort_device)
        sess._sess.run_with_iobinding(bind, None)
        ortvalues = bind.get_outputs()
        return ortvalues[0].numpy()

    return {'predict': {
        'skl': predict_skl_predict,
        'ort': predict_onnxrt_predict,
        'numpy': predict_onnx_inference,
        'ort-bind': predict_onnxrt_predict_bind
    }}
Benchmarks#
def allow_configuration(**kwargs):
    return True


def bench(n_obs, n_features, n_jobss,
          methods, repeat=10, verbose=False):
    res = []
    for nfeat in n_features:

        ntrain = 50000
        X_train = numpy.empty((ntrain, nfeat)).astype(numpy.float32)
        X_train[:, :] = rand(ntrain, nfeat)[:, :]
        eps = rand(ntrain) - 0.5
        y_train = X_train.sum(axis=1) + eps

        for n_jobs in n_jobss:
            fcts = fcts_model(X_train, y_train, n_jobs)

            for n in n_obs:
                for method in methods:

                    if not allow_configuration(n=n, nfeat=nfeat,
                                               n_jobs=n_jobs, method=method):
                        continue

                    obs = dict(n_obs=n, nfeat=nfeat, method=method,
                               n_jobs=n_jobs)

                    # creates different inputs to avoid caching in any ways
                    Xs = []
                    for r in range(repeat):
                        x = numpy.empty((n, nfeat))
                        x[:, :] = rand(n, nfeat)[:, :]
                        Xs.append(x.astype(numpy.float32))

                    for name, fct in fcts[method].items():

                        if name == 'skl':
                            # measures the baseline
                            with config_context(assume_finite=True):
                                st = time()
                                repeated = 0
                                for X in Xs:
                                    p1 = fct(X)
                                    repeated += 1
                                    if time() - st >= 1:
                                        break  # stops if longer than a second
                                end = time()
                                obs["time_skl"] = (end - st) / repeated
                        else:
                            st = time()
                            r2 = 0
                            for X in Xs:
                                p2 = fct(X)
                                r2 += 1
                                if r2 >= repeated:
                                    break
                            end = time()
                            obs["time_" + name] = (end - st) / r2

                    # final
                    res.append(obs)
                    if verbose and (len(res) % 1 == 0 or n >= 10000):
                        print("bench", len(res), ":", obs)

                    # checks that both produce the same outputs
                    if n <= 10000:
                        if len(p1.shape) == 1 and len(p2.shape) == 2:
                            p2 = p2.ravel()
                        try:
                            assert_almost_equal(
                                p1.ravel(), p2.ravel(), decimal=5)
                        except AssertionError as e:
                            warnings.warn(str(e))
    return res
Graphs#
def plot_rf_models(dfr):

    def autolabel(ax, rects):
        for rect in rects:
            height = rect.get_height()
            ax.annotate(f'{height:1.1f}x',
                        xy=(rect.get_x() + rect.get_width() / 2, height),
                        xytext=(0, 3),  # 3 points vertical offset
                        textcoords="offset points",
                        ha='center', va='bottom',
                        fontsize=8)

    engines = [_.split('_')[-1] for _ in dfr.columns if _.startswith("time_")]
    engines = [_ for _ in engines if _ != 'skl']
    for engine in engines:
        dfr[f"speedup_{engine}"] = dfr["time_skl"] / dfr[f"time_{engine}"]
    print(dfr.tail().T)

    ncols = 2
    fig, axs = plt.subplots(len(engines), ncols, figsize=(
        14, 4 * len(engines)), sharey=True)

    row = 0
    for row, engine in enumerate(engines):
        pos = 0
        name = f"LinearRegression - {engine}"
        for nf in sorted(set(dfr.nfeat)):
            for n_jobs in sorted(set(dfr.n_jobs)):
                sub = dfr[(dfr.nfeat == nf) & (dfr.n_jobs == n_jobs)]
                ax = axs[row, pos]
                labels = sub.n_obs
                means = sub[f"speedup_{engine}"]

                x = numpy.arange(len(labels))
                width = 0.90

                rects1 = ax.bar(x, means, width, label='Speedup')
                if pos == 0:
                    # ax.set_yscale('log')
                    ax.set_ylim([0.1, max(dfr[f"speedup_{engine}"])])

                if pos == 0:
                    ax.set_ylabel('Speedup')
                ax.set_title('%s\n%d features\n%d jobs' % (name, nf, n_jobs))
                if row == len(engines) - 1:
                    ax.set_xlabel('batch size')
                ax.set_xticks(x)
                ax.set_xticklabels(labels)
                autolabel(ax, rects1)
                for tick in ax.xaxis.get_major_ticks():
                    tick.label.set_fontsize(8)
                for tick in ax.yaxis.get_major_ticks():
                    tick.label.set_fontsize(8)
                pos += 1

    fig.tight_layout()
    return fig, ax
Run benchs#
@ignore_warnings(category=FutureWarning)
def run_bench(repeat=200, verbose=False):
    n_obs = [1, 10, 100, 1000, 10000]
    methods = ['predict']
    n_features = [10, 50]
    n_jobss = [cpu_count()]

    start = time()
    results = bench(n_obs, n_features, n_jobss,
                    methods, repeat=repeat, verbose=verbose)
    end = time()

    results_df = pandas.DataFrame(results)
    print("Total time = %0.3f sec cpu=%d\n" % (end - start, cpu_count()))

    # plot the results
    return results_df


name = "plot_linear_regression"
df = run_bench(verbose=True)
# df.to_csv("%s.csv" % name, index=False)
# df.to_excel("%s.xlsx" % name, index=False)
somewhere/workspace/onnxcustom/onnxcustom_UT_39_std/_doc/examples/plot_benchmark_inference.py:110: RuntimeWarning: overflow encountered in cast
  X_train = numpy.empty((ntrain, nfeat)).astype(numpy.float32)
bench 1 : {'n_obs': 1, 'nfeat': 10, 'method': 'predict', 'n_jobs': 8, 'time_skl': 0.00014727494039107114, 'time_ort': 4.714031470939517e-05, 'time_numpy': 0.00017335977521724998, 'time_ort-bind': 8.465053513646126e-05}
bench 2 : {'n_obs': 10, 'nfeat': 10, 'method': 'predict', 'n_jobs': 8, 'time_skl': 0.00014802228484768422, 'time_ort': 4.3403309537097815e-05, 'time_numpy': 0.0001723297848366201, 'time_ort-bind': 8.037597523070872e-05}
bench 3 : {'n_obs': 100, 'nfeat': 10, 'method': 'predict', 'n_jobs': 8, 'time_skl': 0.00014994021505117415, 'time_ort': 4.842480004299432e-05, 'time_numpy': 0.0001739592698868364, 'time_ort-bind': 8.561287017073482e-05}
bench 4 : {'n_obs': 1000, 'nfeat': 10, 'method': 'predict', 'n_jobs': 8, 'time_skl': 0.00016795482486486435, 'time_ort': 0.00010173700517043471, 'time_numpy': 0.0001904038997599855, 'time_ort-bind': 0.0001394052745308727}
bench 5 : {'n_obs': 10000, 'nfeat': 10, 'method': 'predict', 'n_jobs': 8, 'time_skl': 0.00024241416540462523, 'time_ort': 0.0005774804297834635, 'time_numpy': 0.0004475092148641124, 'time_ort-bind': 0.0006537431053584441}
somewhere/workspace/onnxcustom/onnxcustom_UT_39_std/_doc/examples/plot_benchmark_inference.py:110: RuntimeWarning: overflow encountered in cast
  X_train = numpy.empty((ntrain, nfeat)).astype(numpy.float32)
bench 6 : {'n_obs': 1, 'nfeat': 50, 'method': 'predict', 'n_jobs': 8, 'time_skl': 0.0002696786349406466, 'time_ort': 8.701475511770696e-05, 'time_numpy': 0.00017341562488581985, 'time_ort-bind': 8.145981468260288e-05}
bench 7 : {'n_obs': 10, 'nfeat': 50, 'method': 'predict', 'n_jobs': 8, 'time_skl': 0.00015068760490976273, 'time_ort': 4.558282962534577e-05, 'time_numpy': 0.0001746026100590825, 'time_ort-bind': 8.327689545694738e-05}
bench 8 : {'n_obs': 100, 'nfeat': 50, 'method': 'predict', 'n_jobs': 8, 'time_skl': 0.00015511580975726246, 'time_ort': 6.745906546711921e-05, 'time_numpy': 0.00017876612022519112, 'time_ort-bind': 0.00010468032502103597}
bench 9 : {'n_obs': 1000, 'nfeat': 50, 'method': 'predict', 'n_jobs': 8, 'time_skl': 0.00019505485019180924, 'time_ort': 0.00029141116479877385, 'time_numpy': 0.0002046256046742201, 'time_ort-bind': 0.0003304108651354909}
bench 10 : {'n_obs': 10000, 'nfeat': 50, 'method': 'predict', 'n_jobs': 8, 'time_skl': 0.00044694092008285225, 'time_ort': 0.0009776719298679381, 'time_numpy': 0.0008014900353737176, 'time_ort-bind': 0.0009818153851665556}
Total time = 5.836 sec cpu=8
Results#
df
Graph#
fig, ax = plot_rf_models(df)
fig.savefig(f"{name}.png")
# plt.show()
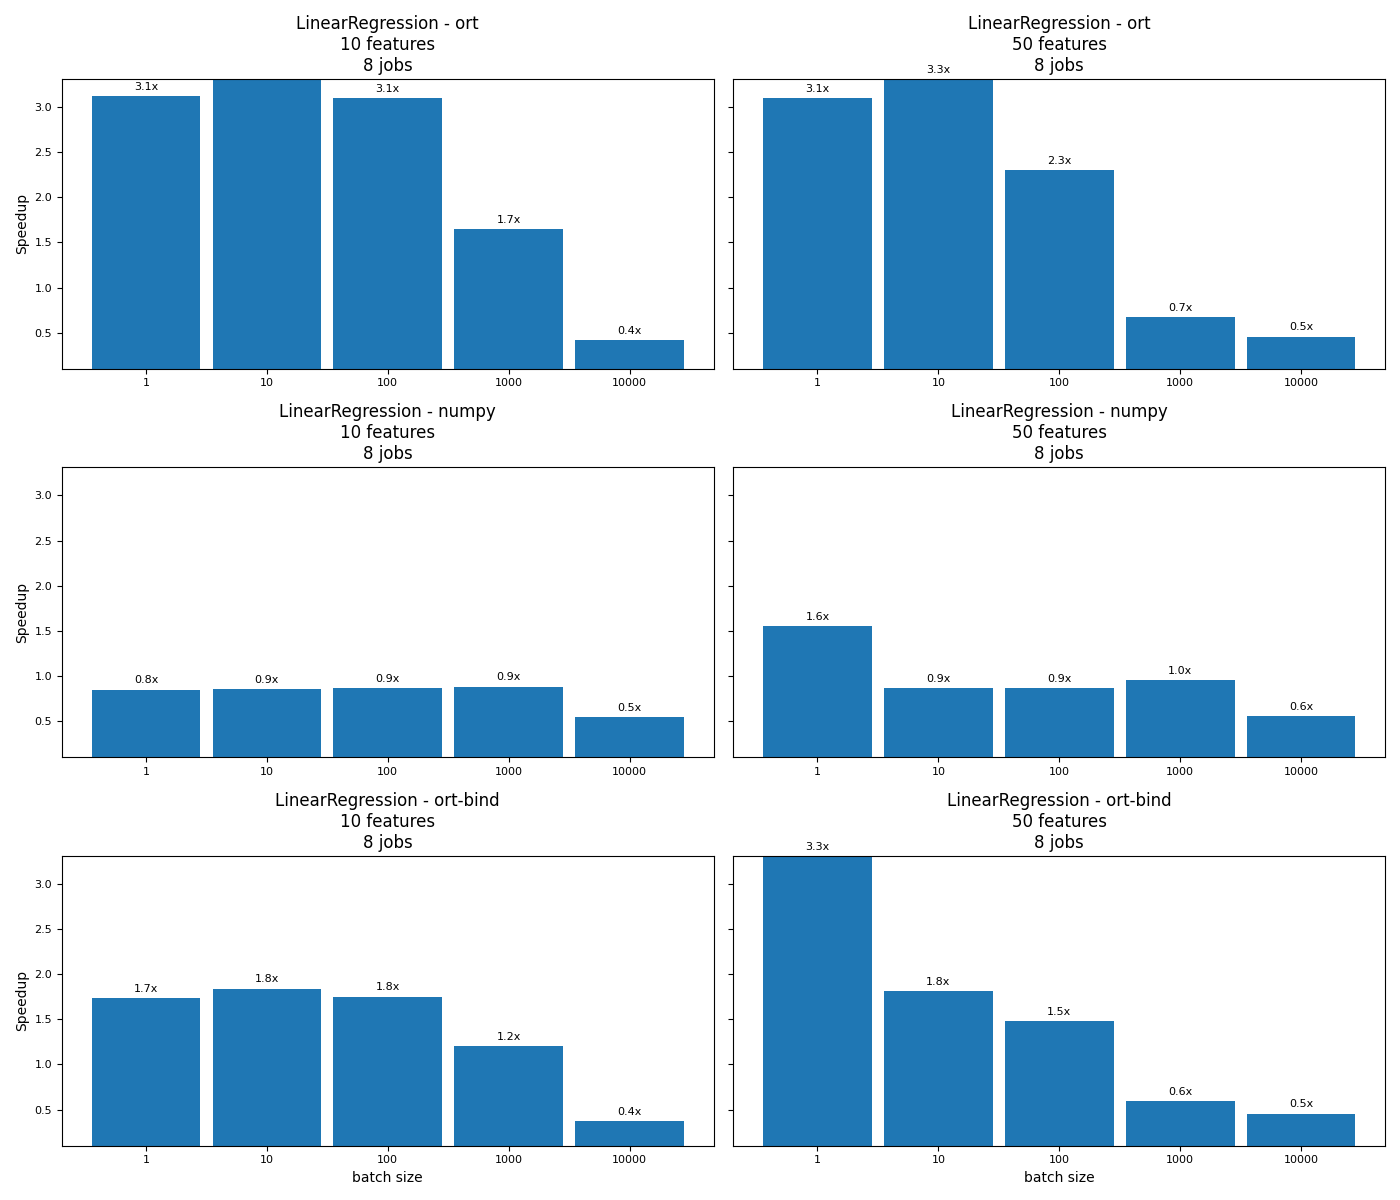
                         5         6         7         8         9
n_obs                    1        10       100      1000     10000
nfeat                   50        50        50        50        50
method             predict   predict   predict   predict   predict
n_jobs                   8         8         8         8         8
time_skl           0.00027  0.000151  0.000155  0.000195  0.000447
time_ort          0.000087  0.000046  0.000067  0.000291  0.000978
time_numpy        0.000173  0.000175  0.000179  0.000205  0.000801
time_ort-bind     0.000081  0.000083  0.000105   0.00033  0.000982
speedup_ort       3.099229  3.305798  2.299406  0.669346  0.457148
speedup_numpy       1.5551  0.863032  0.867703  0.953228  0.557638
speedup_ort-bind  3.310573  1.809477  1.481805   0.59034  0.455219
somewhere/workspace/onnxcustom/onnxcustom_UT_39_std/_doc/examples/plot_benchmark_inference.py:232: MatplotlibDeprecationWarning: The label function was deprecated in Matplotlib 3.1 and will be removed in 3.8. Use Tick.label1 instead.
  tick.label.set_fontsize(8)
somewhere/workspace/onnxcustom/onnxcustom_UT_39_std/_doc/examples/plot_benchmark_inference.py:234: MatplotlibDeprecationWarning: The label function was deprecated in Matplotlib 3.1 and will be removed in 3.8. Use Tick.label1 instead.
  tick.label.set_fontsize(8)
Total running time of the script: ( 0 minutes 8.569 seconds)