module plotting.plot_bench_xtime
Short summary
module pymlbenchmark.plotting.plot_bench_xtime
Plotting for benchmarks.
Functions
function |
truncated documentation |
|---|---|
Plots benchmark acceleration. |
Documentation
Plotting for benchmarks.
- pymlbenchmark.plotting.plot_bench_xtime.plot_bench_xtime(df, row_cols=None, col_cols=None, hue_cols=None, cmp_col_values=('lib', 'skl'), x_value='mean', y_value='xtime', parallel=(1.0, 0.5), title=None, box_side=6, labelsize=10, fontsize='small', label_fct=None, color_fct=None, ax=None)
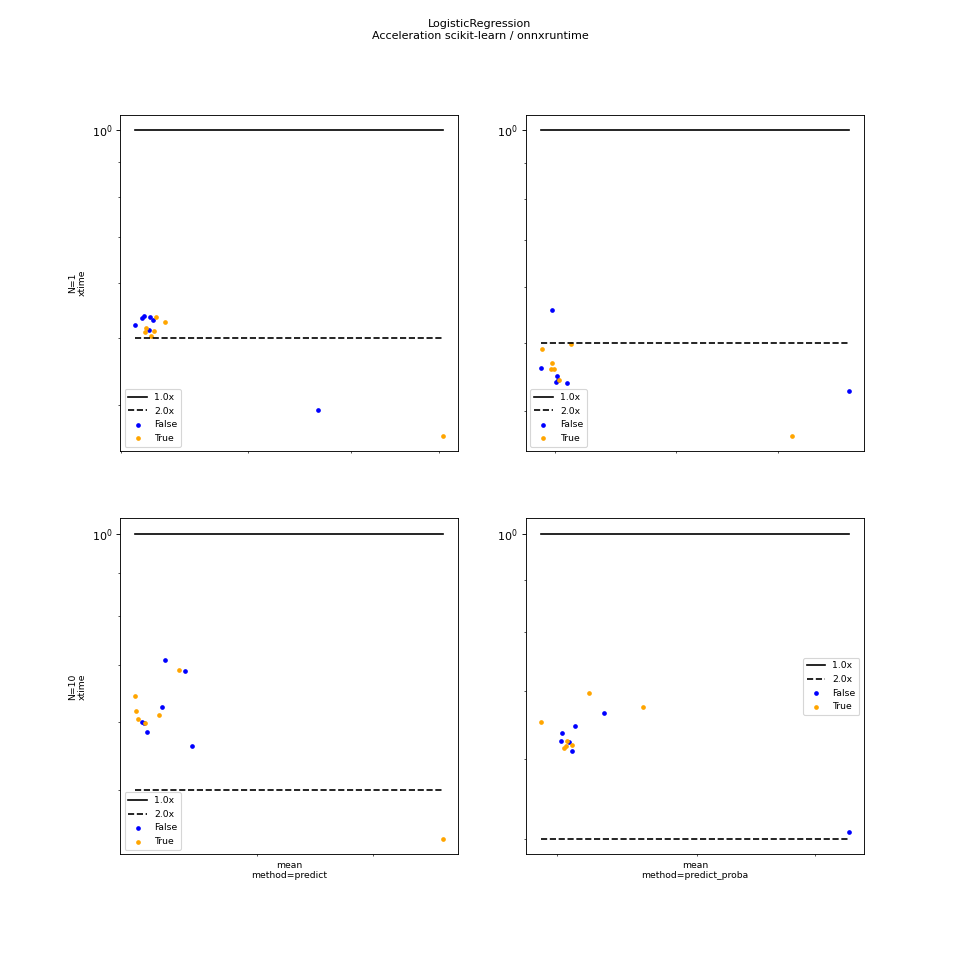
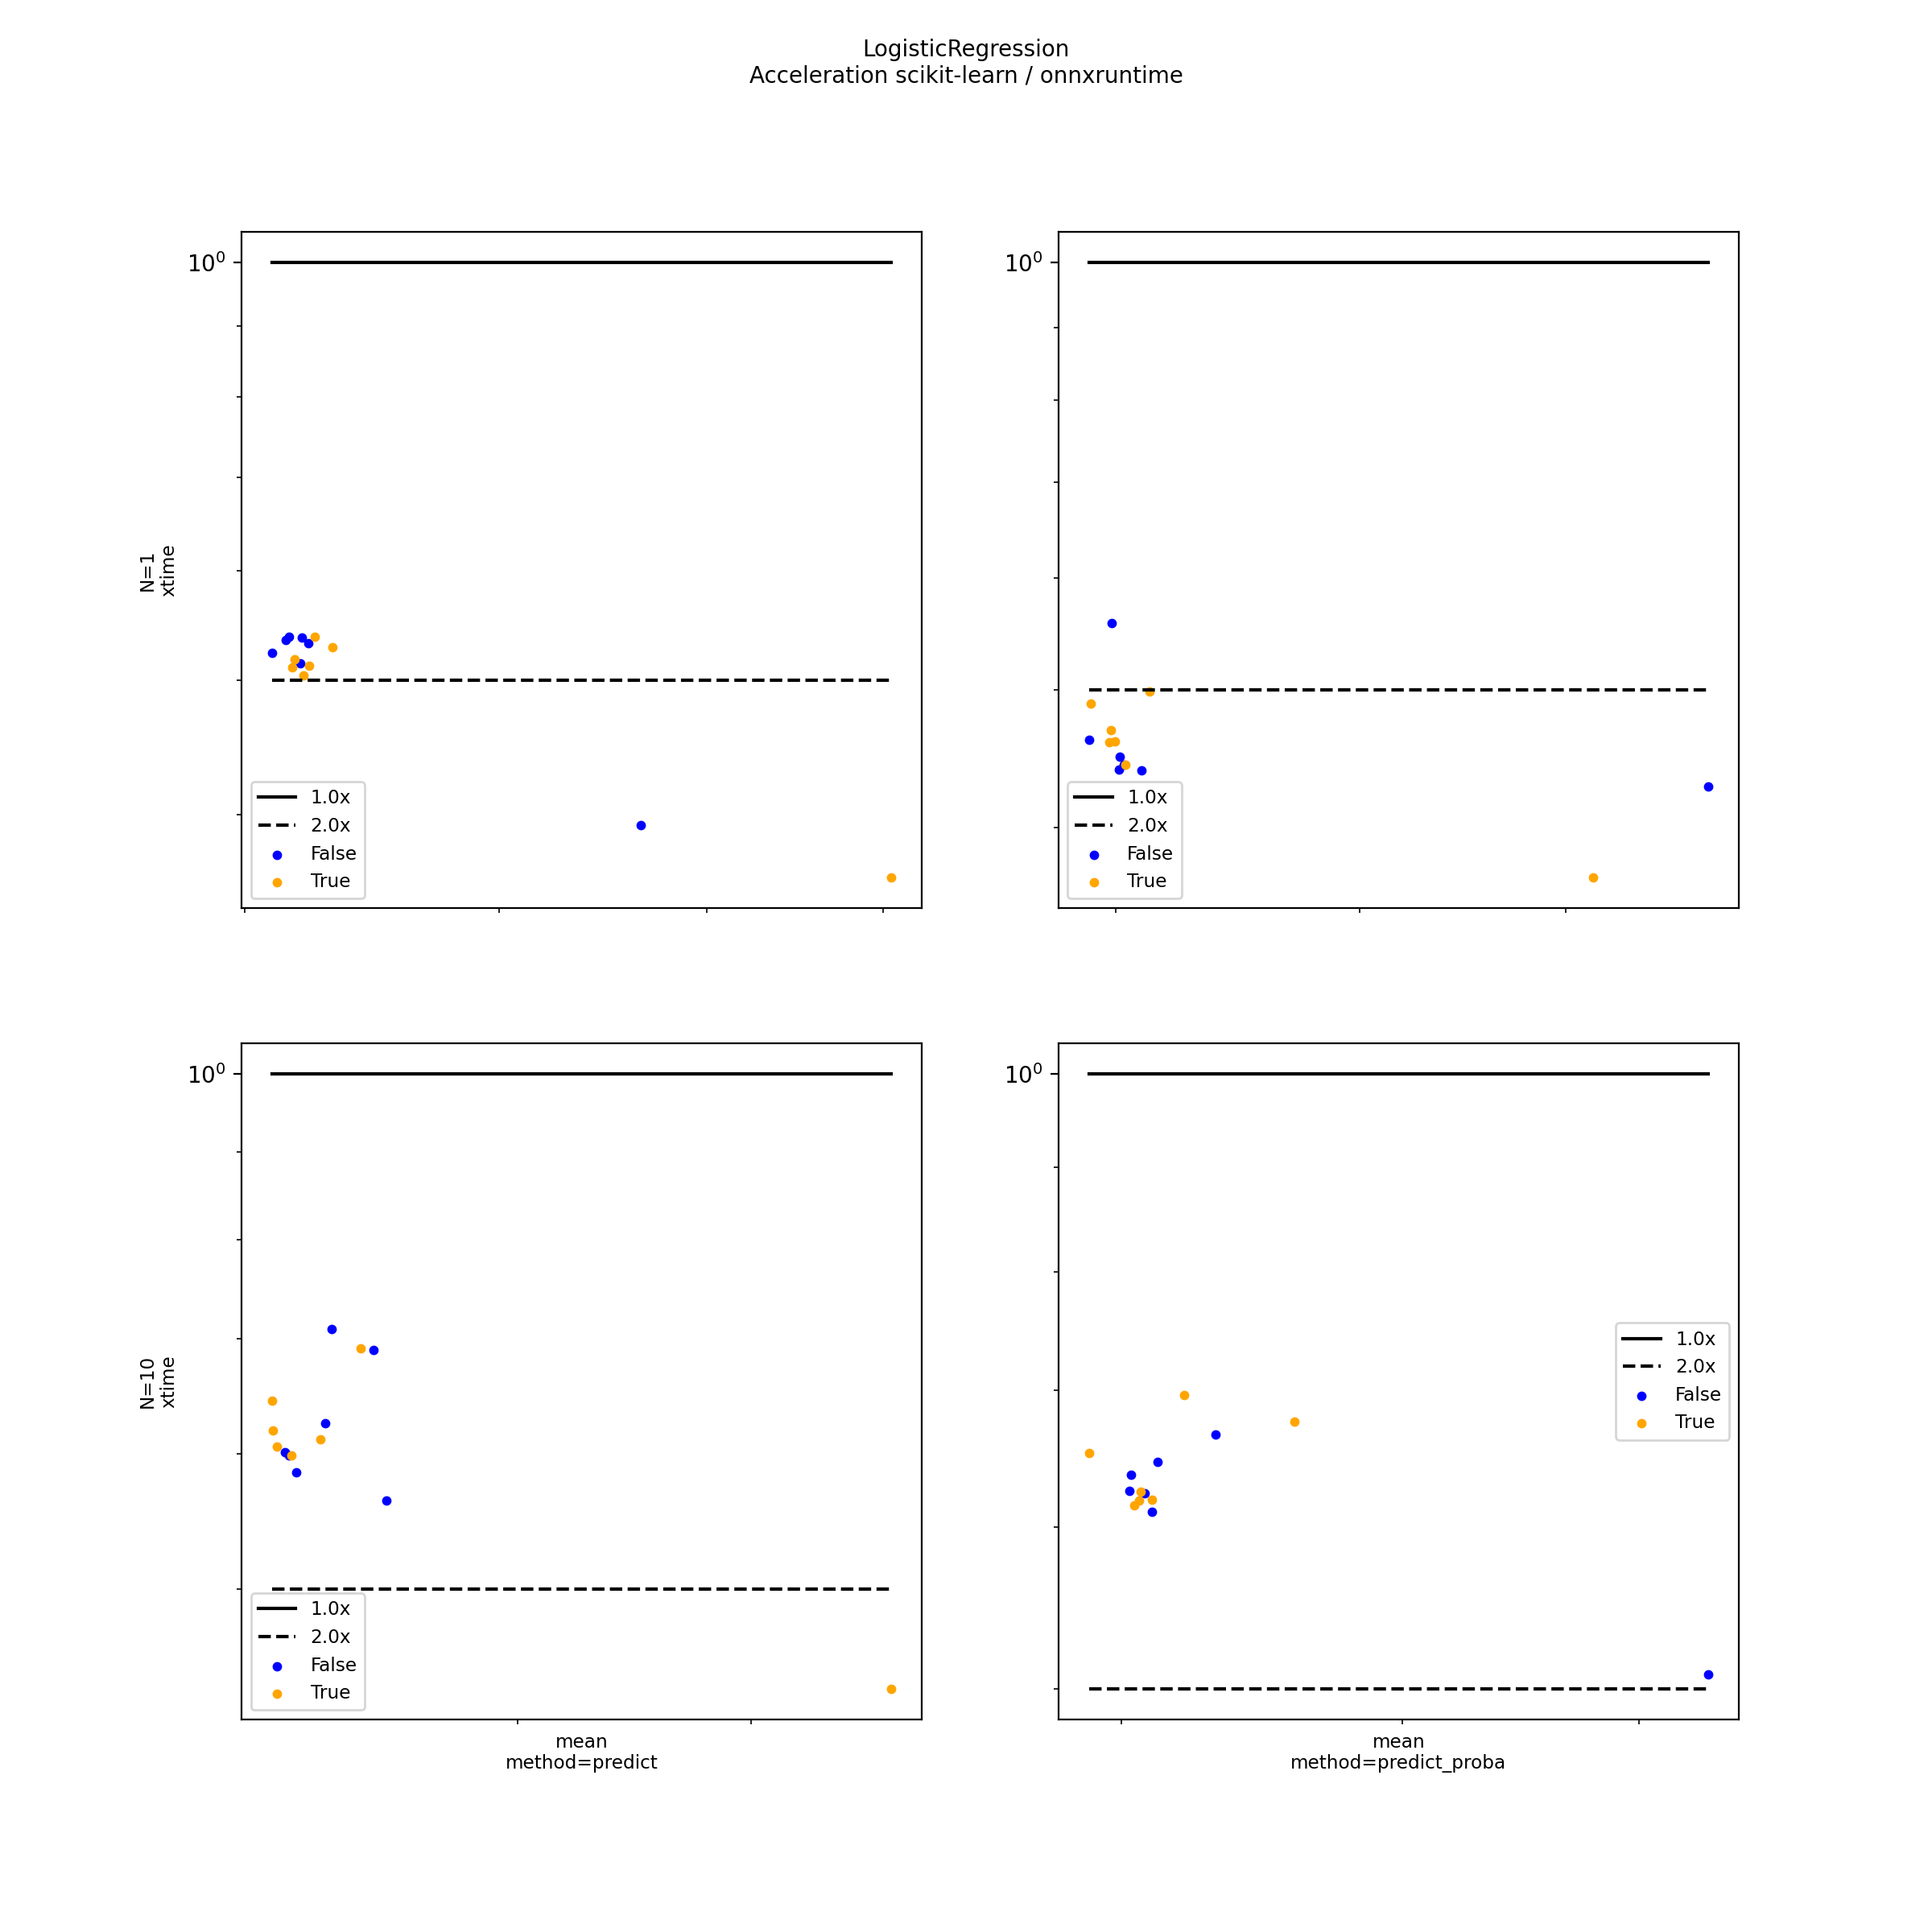
Plots benchmark acceleration.
- Parameters:
df – benchmark results
row_cols – dataframe columns for graph rows
col_cols – dataframe columns for graph columns
hue_cols – dataframe columns for other options
cmp_col_values – it can be one column or one tuple
(column, baseline name)x_value – value for x-axis
y_value – value to plot on y-axis (such as mean, min, …)
parallel – lower and upper bounds
title – graph title
box_side – graph side, the function adjusts the size of the graph
labelsize – size of the labels
fontsize – font size see Text properties
ax – existing axis
label_fct – if not None, it is a function which modifies the label before printing it on the graph
color_fct – if not None, it is a function which modifies a color based on the label and the previous color
- Returns:
fig, ax
Plot benchmark improvments
from pymlbenchmark.datasets import experiment_results
from pymlbenchmark.plotting import plot_bench_xtime
import matplotlib.pyplot as plt

df = experiment_results('onnxruntime_LogisticRegression')

plot_bench_xtime(df, row_cols='N', col_cols='method',
                 hue_cols='fit_intercept',
                 title="LogisticRegression\nAcceleration scikit-learn / onnxruntime")
plt.show()