Benchmark (ONNX) for Scaler#
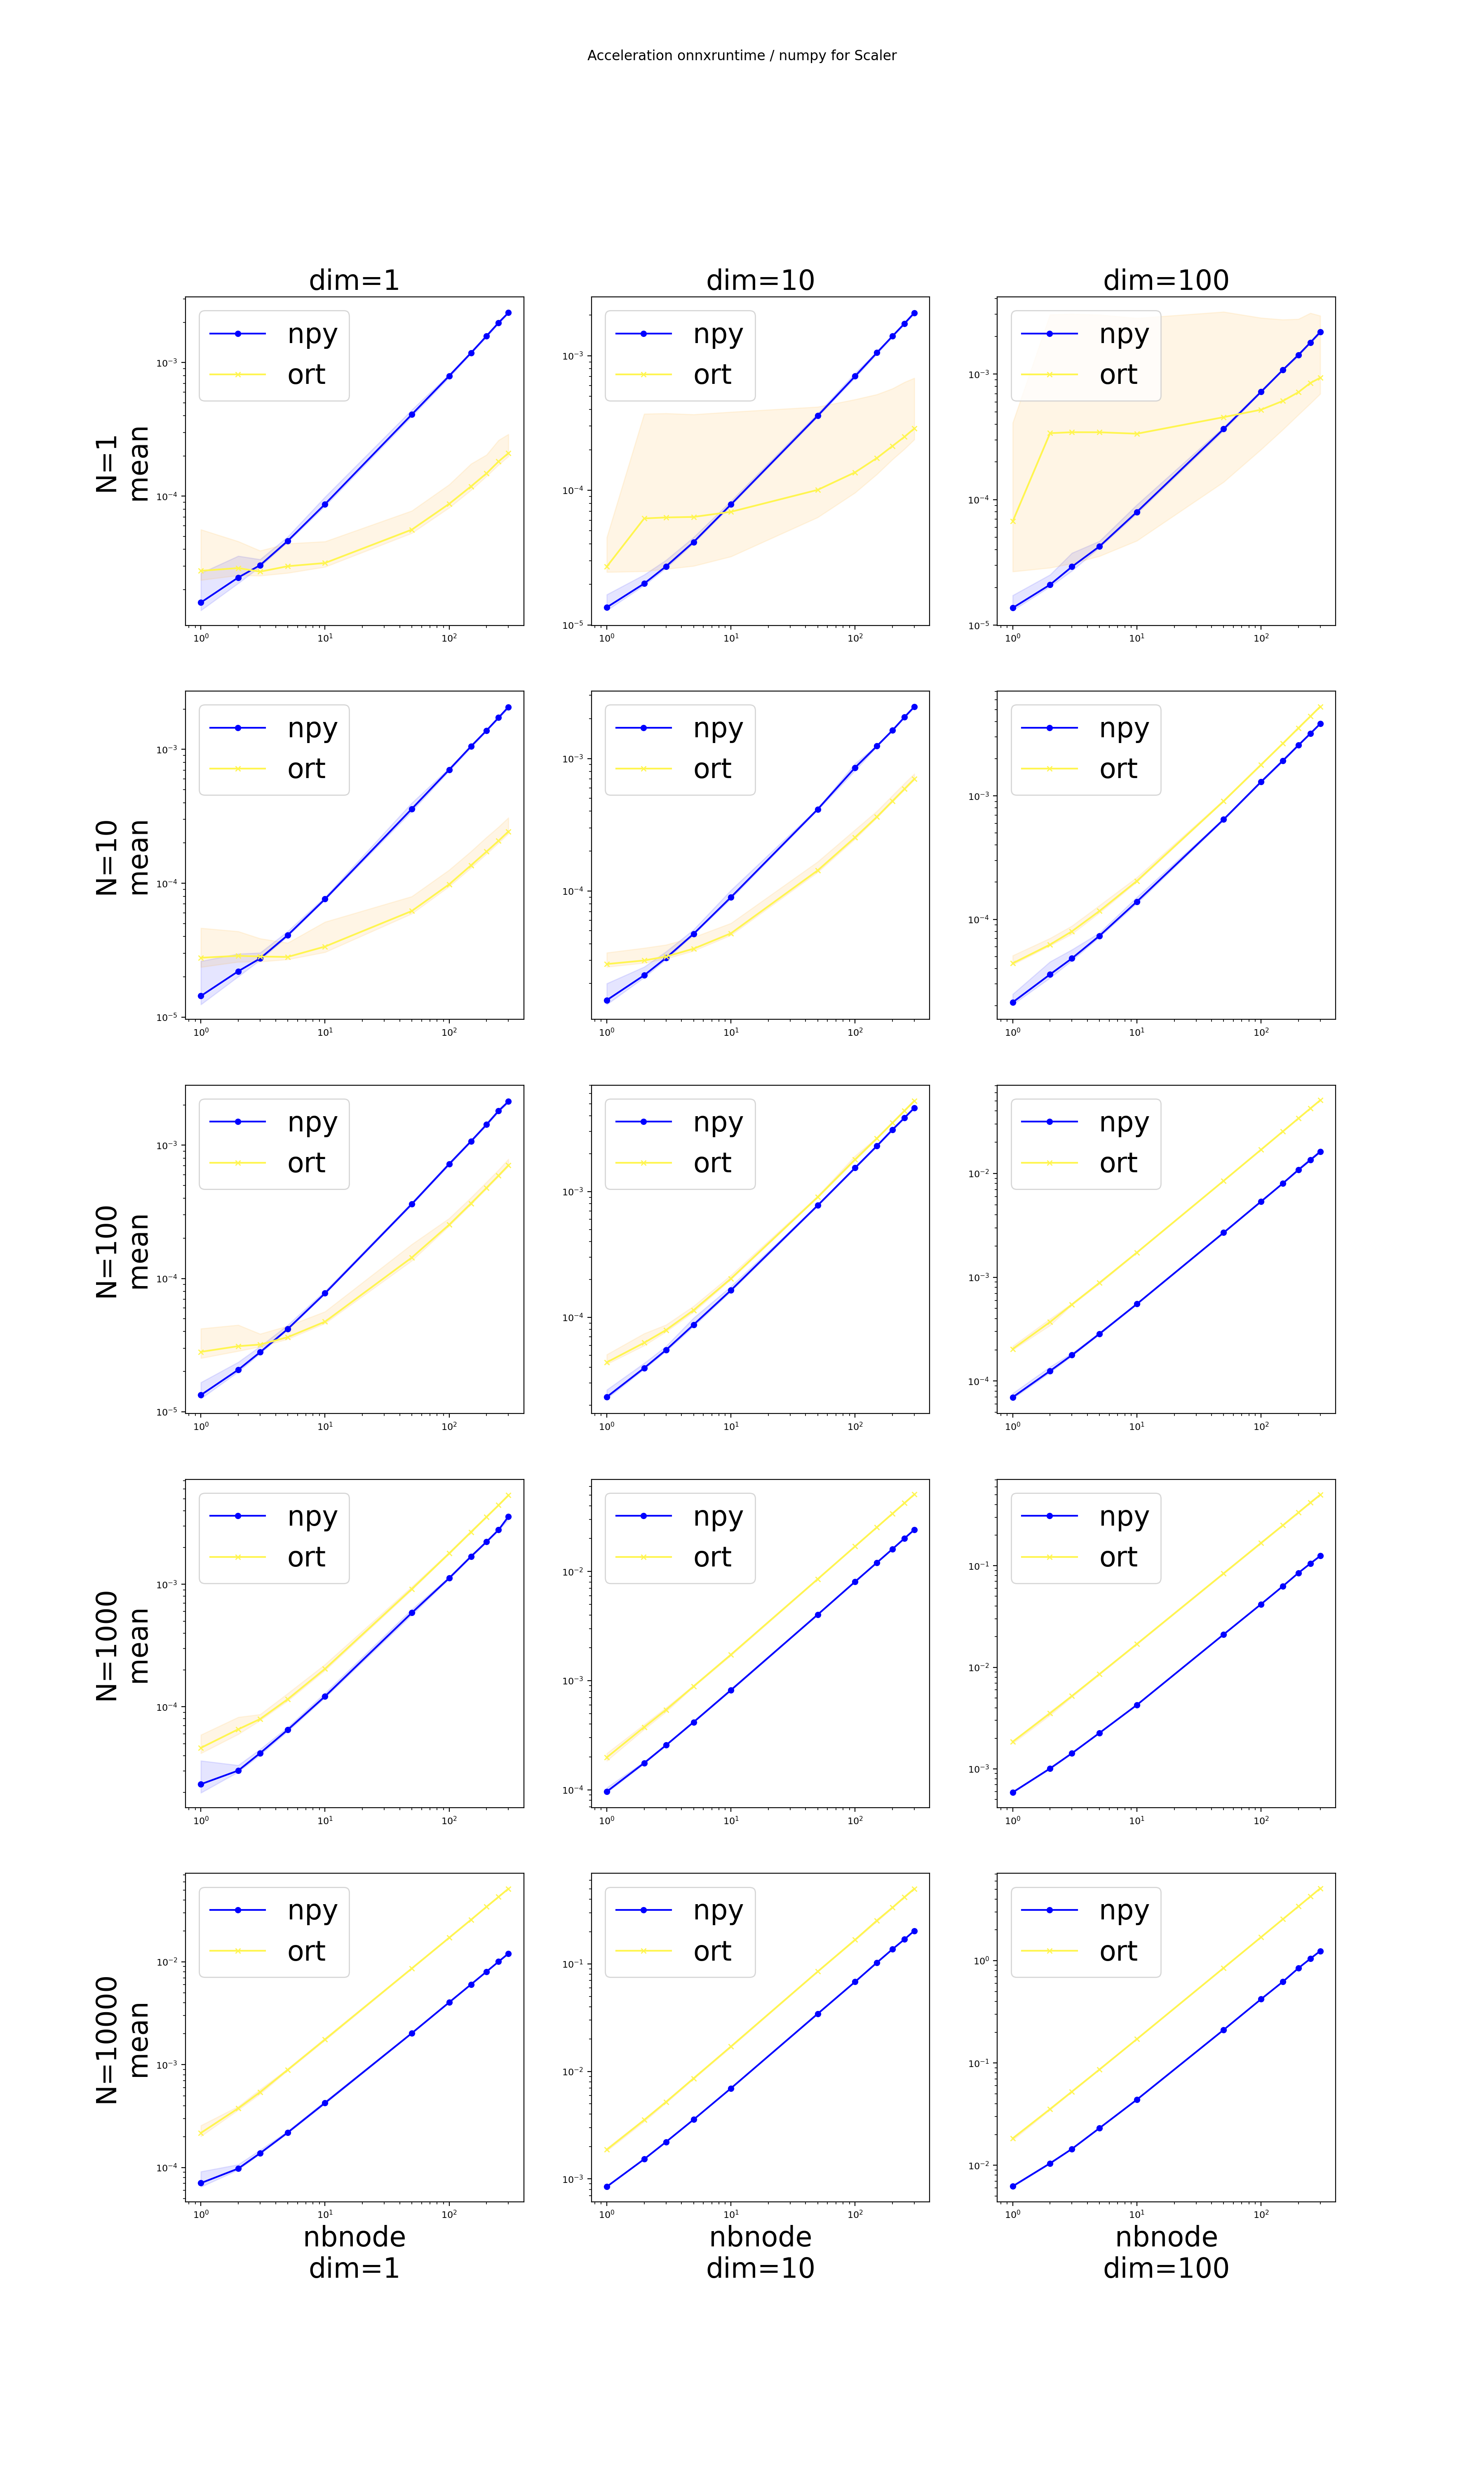
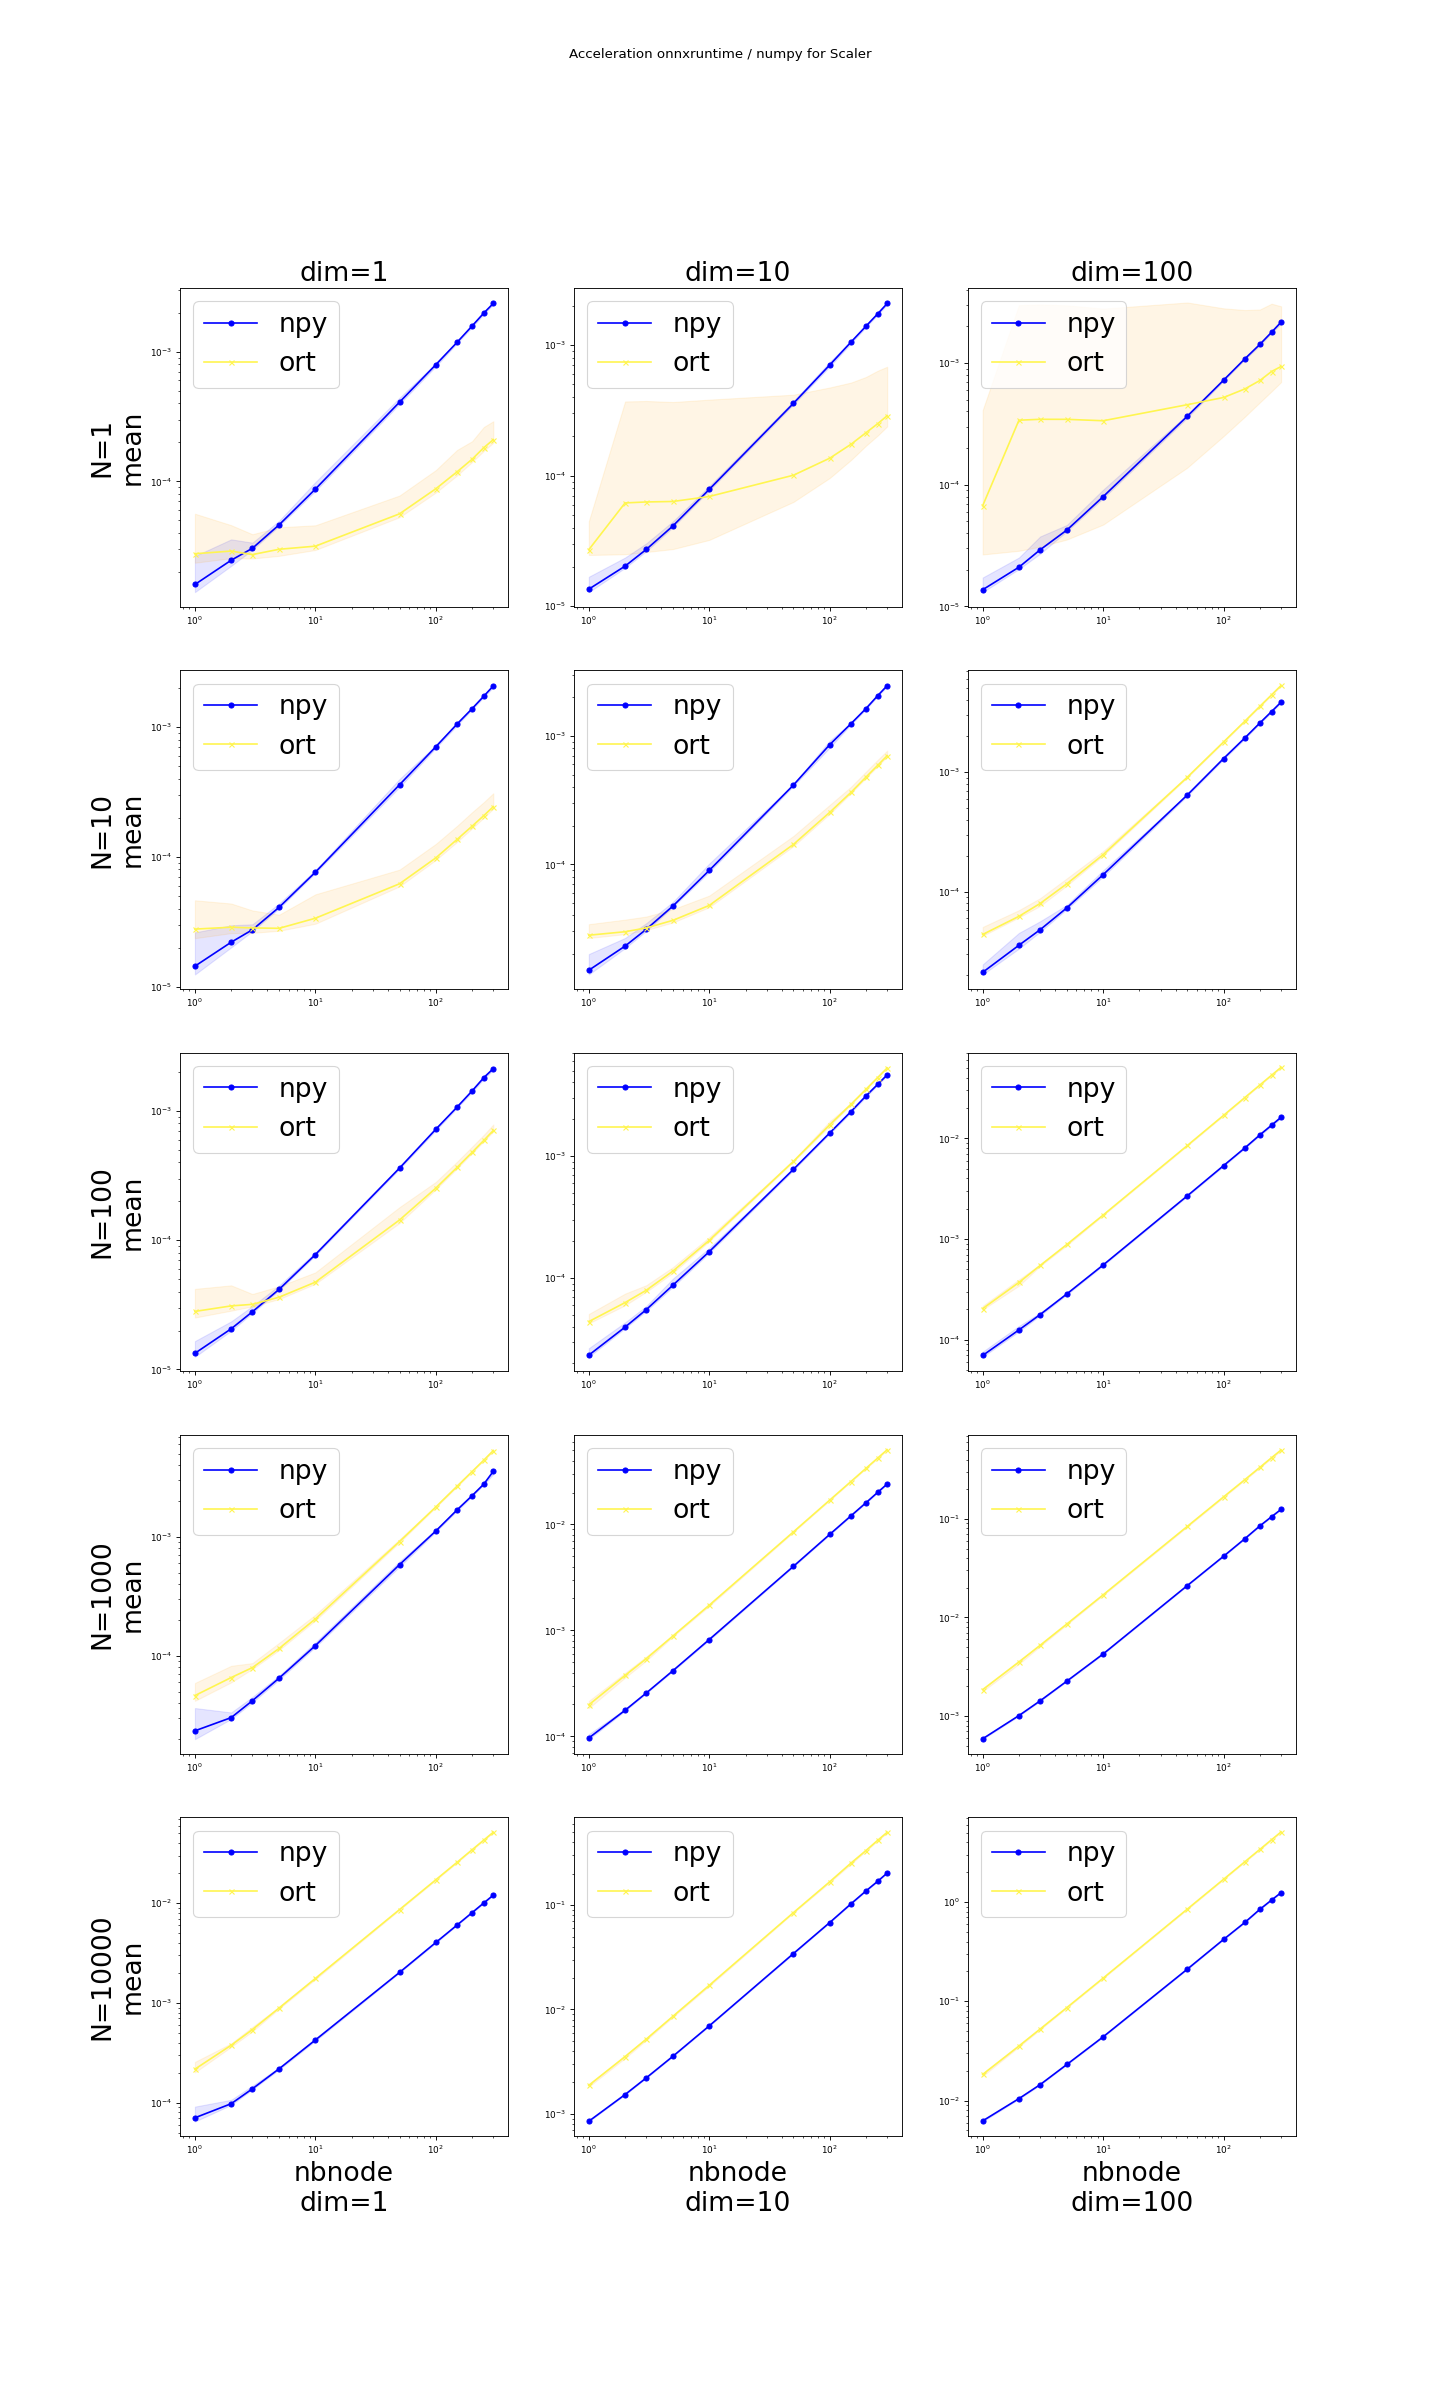
The experiment compares the execution time between numpy and onnxruntime for a series (or cascade) of scaling.

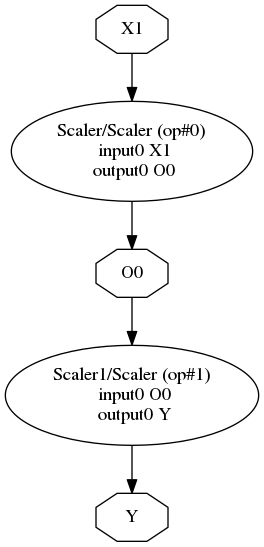
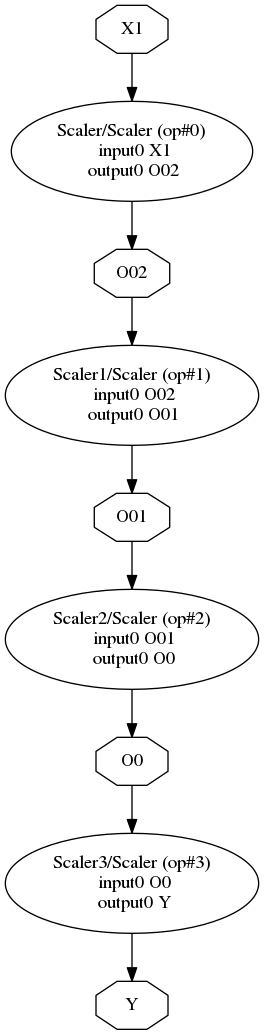
k is named the number of nodes and the corresponding ONNX graph for k=2 or 4 looks like a cascade of operators Scaler. numpy use BLAS functions, onnxruntime does not.
k=2 |
k=4 |
|
|
Overview#
(Source code, png, hires.png, pdf)
Configuration#
<<<
from pyquickhelper.pandashelper import df2rst
import pandas
name = os.path.join(
    __WD__, "../../onnx/results/bench_plot_onnxruntime_casc_scaler.time.csv")
df = pandas.read_csv(name)
print(df2rst(df, number_format=4))
>>>
name |
version |
value |
|---|---|---|
date |
2019-12-11 |
|
python |
3.7.2 (default, Mar 1 2019, 18:34:21) [GCC 6.3.0 20170516] |
|
platform |
linux |
|
OS |
Linux-4.9.0-8-amd64-x86_64-with-debian-9.6 |
|
machine |
x86_64 |
|
processor |
||
release |
4.9.0-8-amd64 |
|
architecture |
(‘64bit’, ‘’) |
|
mlprodict |
not-imported |
|
numpy |
1.17.4 |
openblas, language=c |
onnx |
1.6.34 |
opset=12 |
onnxruntime |
1.1.992 |
CPU-MKL-ML |
pandas |
0.25.3 |
|
skl2onnx |
1.6.992 |
|
sklearn |
0.22 |
Raw results#
bench_plot_onnxruntime_casc_scaler.csv
<<<
from pyquickhelper.pandashelper import df2rst
from pymlbenchmark.benchmark.bench_helper import bench_pivot
import pandas
name = os.path.join(
    __WD__, "../../onnx/results/bench_plot_onnxruntime_casc_scaler.perf.csv")
df = pandas.read_csv(name)
piv = bench_pivot(df).reset_index(drop=False)
piv['speedup'] = piv['npy'] / piv['ort']
print(df2rst(piv, number_format=4))
Benchmark code#
bench_plot_onnxruntime_casc_scaler.py
# coding: utf-8
"""
Benchmark of :epkg:`onnxruntime` for a cascade of scalers (additions).
"""
# Authors: Xavier Dupré (benchmark)
# License: MIT
import matplotlib
matplotlib.use('Agg')

import os
import unittest
import warnings
import contextlib
from time import perf_counter as time
from io import StringIO
import numpy
import pandas
import matplotlib.pyplot as plt
import sklearn
from sklearn.utils._testing import ignore_warnings
from sklearn.utils.extmath import softmax
from pyquickhelper.loghelper import run_cmd, sys_path_append
from pymlbenchmark.benchmark import BenchPerfTest, BenchPerf
from pymlbenchmark.context import machine_information
from pymlbenchmark.datasets.artificial import random_binary_classification
from pymlbenchmark.plotting import plot_bench_results
from skl2onnx.common.data_types import FloatTensorType
from skl2onnx.algebra.onnx_ops import OnnxScaler
from onnxruntime import InferenceSession
from mlprodict import get_ir_version, __max_supported_opset__

################################
# Benchmark
# +++++++++


def generate_onnx_graph(dim, nbnode, input_name='X1'):
    """Generates a series of consecutive scalers."""

    matrices = []
    scale = list(numpy.ones((1, dim)).ravel())
    i1 = input_name
    for i in range(nbnode - 1):
        i2 = list(-random_binary_classification(1, dim)[0].ravel())
        matrices.append(i2)
        node = OnnxScaler(i1, offset=i2, scale=scale)
        i1 = node
    i2 = list(-random_binary_classification(1, dim)[0].ravel())
    matrices.append(i2)
    node = OnnxScaler(i1, offset=i2, scale=scale, output_names=['Y'])
    onx = node.to_onnx([(input_name, FloatTensorType((None, dim)))],
                       outputs=[('Y', FloatTensorType((None, dim)))])
    onx.ir_version = get_ir_version(__max_supported_opset__)
    return onx, matrices


class GraphORtBenchPerfTest(BenchPerfTest):
    def __init__(self, dim=4, nbnode=3):
        BenchPerfTest.__init__(self)
        self.input_name = 'X1'
        self.nbnode = nbnode
        self.scale = numpy.ones((1, dim))
        self.onx, self.matrices = generate_onnx_graph(dim,
                                                      nbnode, self.input_name)
        as_string = self.onx.SerializeToString()
        try:
            self.ort = InferenceSession(as_string)
        except RuntimeError as e:
            raise RuntimeError("Issue with {}\n{}".format(
                e, self.onx))

    def fcts(self, **kwargs):

        def predict_ort(X, model=self.ort):
            return self.ort.run(None, {self.input_name: X})[0]

        def predict_npy(X, model=self.matrices, scale=self.scale):
            res = X.copy()
            for mat in model:
                res += X
                res *= scale
            return res

        return [{'lib': 'ort', 'fct': predict_ort},
                {'lib': 'npy', 'fct': predict_npy}]

    def data(self, N=10, dim=4, **kwargs):  # pylint: disable=W0221
        return tuple(o.astype(numpy.float32)
                     for o in random_binary_classification(N, dim)[:1])


@ignore_warnings(category=FutureWarning)
def run_bench(repeat=20, number=2, verbose=False):

    pbefore = dict(dim=[1, 10, 100],
                   nbnode=[1, 2, 3, 5, 10, 50, 100, 150, 200, 250, 300])
    pafter = dict(N=[1, 10, 100, 1000, 10000])

    test = lambda dim=None, **opts: GraphORtBenchPerfTest(dim=dim, **opts)
    bp = BenchPerf(pbefore, pafter, test)

    with sklearn.config_context(assume_finite=True):
        start = time()
        results = list(bp.enumerate_run_benchs(repeat=repeat, verbose=verbose,
                                               number=number, stop_if_error=False))
        end = time()

    results_df = pandas.DataFrame(results)
    print("Total time = %0.3f sec\n" % (end - start))
    return results_df

#########################
# Runs the benchmark
# ++++++++++++++++++


filename = os.path.splitext(os.path.split(__file__)[-1])[0]
df = run_bench(verbose=True)
df.to_csv("%s.perf.csv" % filename, index=False)
print(df.head())

#########################
# Extracts information about the machine used
# +++++++++++++++++++++++++++++++++++++++++++

pkgs = ['numpy', 'pandas', 'sklearn', 'skl2onnx',
        'onnxruntime', 'onnx', 'mlprodict']
dfi = pandas.DataFrame(machine_information(pkgs))
dfi.to_csv("%s.time.csv" % filename, index=False)
print(dfi)


#############################
# Plot the results by number of nodes
# +++++++++++++++++++++++++++++++++++

def label_fct(la):
    la = la.replace("onxpython_compiled", "opy")
    la = la.replace("onxpython", "opy")
    la = la.replace("onxonnxruntime1", "ort")
    la = la.replace("fit_intercept", "fi")
    la = la.replace("True", "1")
    la = la.replace("False", "0")
    la = la.replace("max_depth", "mxd")
    return la


from pymlbenchmark.plotting import plot_bench_results
plot_bench_results(df, row_cols='N', col_cols='dim',
                   x_value='nbnode',
                   title="%s\nBenchmark scikit-learn / onnxruntime" % "Cascade Scaler",
                   label_fct=label_fct)

plt.savefig("%s.node.png" % filename)


##################################
# Plot one ONNX graph
# +++++++++++++++++++

for nbnode in (2, 4):
    onx = generate_onnx_graph(5, nbnode)[0]

    from onnx.tools.net_drawer import GetPydotGraph, GetOpNodeProducer
    pydot_graph = GetPydotGraph(onx.graph, name=onx.graph.name, rankdir="TB",
                                node_producer=GetOpNodeProducer("docstring"))
    pydot_graph.write_dot("graph.%d.dot" % nbnode)
    os.system('dot -O -Tpng graph.%d.dot' % nbnode)

image = plt.imread("graph.%d.dot.png" % nbnode)
plt.imshow(image)
plt.axis('off')
plt.savefig("%s.%d.node.png" % (filename, nbnode))

import sys
if "--quiet" not in sys.argv:
    plt.show()