module timeseries.plotting#
Short summary#
module mlinsights.timeseries.plotting
Timeseries plots.
Functions#
function |
truncated documentation |
|---|---|
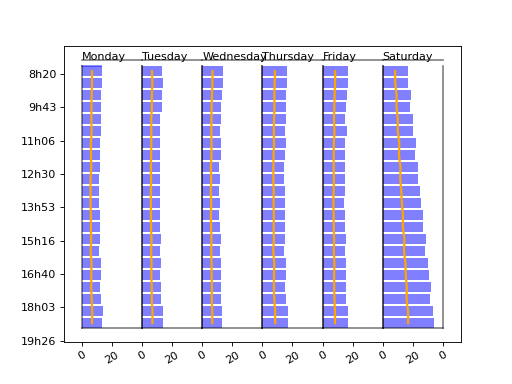
Shows a timeseries dispatched by days as bars. |
Documentation#
Timeseries plots.
- mlinsights.timeseries.plotting.plot_week_timeseries(time, value, normalise=True, label=None, h=0.85, value2=None, label2=None, daynames=None, xfmt='%1.0f', ax=None)#
Shows a timeseries dispatched by days as bars.
- Parameters:
time – dates
value – values to display as bars.
normalise – normalise data before showing it
label – label of the series
values2 – second series to show as a line
label2 – label of the second series
daynames – names to use for week day names (default is English)
xfmt – format number of the X axis
ax – existing axis
- Returns:
axis
import datetime
import matplotlib.pyplot as plt
from mlinsights.timeseries.datasets import artificial_data
from mlinsights.timeseries.agg import aggregate_timeseries
from mlinsights.timeseries.plotting import plot_week_timeseries

dt1 = datetime.datetime(2019, 8, 1)
dt2 = datetime.datetime(2019, 9, 1)
data = artificial_data(dt1, dt2, minutes=15)
print(data.head())

agg = aggregate_timeseries(data, per='week')
plot_week_timeseries(
    agg['weektime'], agg['y'], label="y",
    value2=agg['y']/2, label2="y/2", normalise=False)
plt.show()
