Note
Go to the end to download the full example code
Compares dot implementations (numpy, cython, c++, sse)
numpy has a very fast implementation of the dot product. It is difficult to be better and very easy to be slower. This example looks into a couple of slower implementations with cython. The tested functions are the following:
import numpy
import matplotlib.pyplot as plt
from pandas import DataFrame, concat
from td3a_cpp.tutorial.dot_cython import (
    dot_product, ddot_cython_array,
    ddot_cython_array_optim, ddot_array,
    ddot_array_16, ddot_array_16_sse
)
from td3a_cpp.tutorial.dot_cython import (
    sdot_cython_array,
    sdot_cython_array_optim, sdot_array,
    sdot_array_16, sdot_array_16_sse
)
from td3a_cpp.tools import measure_time_dim


def get_vectors(fct, n, h=100, dtype=numpy.float64):
    ctxs = [dict(va=numpy.random.randn(n).astype(dtype),
                 vb=numpy.random.randn(n).astype(dtype),
                 dot=fct,
                 x_name=n)
            for n in range(10, n, h)]
    return ctxs
numpy dot
ctxs = get_vectors(numpy.dot, 10000)
df = DataFrame(list(measure_time_dim('dot(va, vb)', ctxs, verbose=1)))
df['fct'] = 'numpy.dot'
print(df.tail(n=3))
dfs = [df]
  0%|          | 0/100 [00:00<?, ?it/s]
 18%|#8        | 18/100 [00:00<00:00, 179.00it/s]
 36%|###6      | 36/100 [00:00<00:00, 157.39it/s]
 52%|#####2    | 52/100 [00:00<00:00, 141.76it/s]
 67%|######7   | 67/100 [00:00<00:00, 128.59it/s]
 81%|########1 | 81/100 [00:00<00:00, 117.66it/s]
 93%|#########3| 93/100 [00:00<00:00, 108.65it/s]
100%|##########| 100/100 [00:00<00:00, 118.96it/s]
     average     deviation  min_exec  ...  context_size  x_name        fct
97  0.000021  5.178455e-07  0.000021  ...           232    9710  numpy.dot
98  0.000022  3.533129e-07  0.000021  ...           232    9810  numpy.dot
99  0.000021  3.556189e-07  0.000021  ...           232    9910  numpy.dot

[3 rows x 9 columns]
Several cython dot
for fct in [dot_product, ddot_cython_array,
            ddot_cython_array_optim, ddot_array,
            ddot_array_16, ddot_array_16_sse]:
    ctxs = get_vectors(fct, 10000 if fct.__name__ != 'dot_product' else 1000)

    df = DataFrame(list(measure_time_dim('dot(va, vb)', ctxs, verbose=1)))
    df['fct'] = fct.__name__
    dfs.append(df)
    print(df.tail(n=3))
  0%|          | 0/10 [00:00<?, ?it/s]
 30%|###       | 3/10 [00:00<00:00, 18.65it/s]
 50%|#####     | 5/10 [00:00<00:00,  8.77it/s]
 70%|#######   | 7/10 [00:01<00:00,  5.52it/s]
 80%|########  | 8/10 [00:01<00:00,  4.57it/s]
 90%|######### | 9/10 [00:01<00:00,  3.80it/s]
100%|##########| 10/10 [00:02<00:00,  3.23it/s]
100%|##########| 10/10 [00:02<00:00,  4.42it/s]
    average  deviation  min_exec  ...  context_size  x_name          fct
7  0.000689   0.000001  0.000687  ...           232     710  dot_product
8  0.000800   0.000009  0.000788  ...           232     810  dot_product
9  0.000883   0.000002  0.000880  ...           232     910  dot_product

[3 rows x 9 columns]

  0%|          | 0/100 [00:00<?, ?it/s]
 25%|##5       | 25/100 [00:00<00:00, 241.97it/s]
 50%|#####     | 50/100 [00:00<00:00, 169.46it/s]
 69%|######9   | 69/100 [00:00<00:00, 135.10it/s]
 84%|########4 | 84/100 [00:00<00:00, 114.63it/s]
 97%|#########7| 97/100 [00:00<00:00, 100.00it/s]
100%|##########| 100/100 [00:00<00:00, 116.14it/s]
     average     deviation  min_exec  ...  context_size  x_name                fct
97  0.000028  3.700952e-07  0.000028  ...           232    9710  ddot_cython_array
98  0.000026  2.974104e-07  0.000026  ...           232    9810  ddot_cython_array
99  0.000027  3.292713e-07  0.000027  ...           232    9910  ddot_cython_array

[3 rows x 9 columns]

  0%|          | 0/100 [00:00<?, ?it/s]
 25%|##5       | 25/100 [00:00<00:00, 241.98it/s]
 50%|#####     | 50/100 [00:00<00:00, 169.08it/s]
 69%|######9   | 69/100 [00:00<00:00, 135.27it/s]
 84%|########4 | 84/100 [00:00<00:00, 114.78it/s]
 97%|#########7| 97/100 [00:00<00:00, 100.03it/s]
100%|##########| 100/100 [00:00<00:00, 116.18it/s]
     average     deviation  ...  x_name                      fct
97  0.000028  3.334358e-07  ...    9710  ddot_cython_array_optim
98  0.000026  3.291796e-07  ...    9810  ddot_cython_array_optim
99  0.000027  3.524659e-07  ...    9910  ddot_cython_array_optim

[3 rows x 9 columns]

  0%|          | 0/100 [00:00<?, ?it/s]
 22%|##2       | 22/100 [00:00<00:00, 209.08it/s]
 43%|####3     | 43/100 [00:00<00:00, 158.78it/s]
 60%|######    | 60/100 [00:00<00:00, 130.49it/s]
 74%|#######4  | 74/100 [00:00<00:00, 112.22it/s]
 86%|########6 | 86/100 [00:00<00:00, 99.31it/s]
 97%|#########7| 97/100 [00:00<00:00, 89.15it/s]
100%|##########| 100/100 [00:00<00:00, 105.45it/s]
     average     deviation  min_exec  ...  context_size  x_name         fct
97  0.000030  3.052402e-07  0.000029  ...           232    9710  ddot_array
98  0.000028  3.068461e-07  0.000028  ...           232    9810  ddot_array
99  0.000028  3.308606e-07  0.000028  ...           232    9910  ddot_array

[3 rows x 9 columns]

  0%|          | 0/100 [00:00<?, ?it/s]
 23%|##3       | 23/100 [00:00<00:00, 219.82it/s]
 45%|####5     | 45/100 [00:00<00:00, 165.47it/s]
 63%|######3   | 63/100 [00:00<00:00, 135.41it/s]
 78%|#######8  | 78/100 [00:00<00:00, 116.05it/s]
 91%|#########1| 91/100 [00:00<00:00, 102.19it/s]
100%|##########| 100/100 [00:00<00:00, 112.42it/s]
     average     deviation  min_exec  ...  context_size  x_name            fct
97  0.000027  3.669000e-07  0.000027  ...           232    9710  ddot_array_16
98  0.000027  4.026772e-07  0.000026  ...           232    9810  ddot_array_16
99  0.000026  2.207400e-07  0.000026  ...           232    9910  ddot_array_16

[3 rows x 9 columns]

  0%|          | 0/100 [00:00<?, ?it/s]
 24%|##4       | 24/100 [00:00<00:00, 231.74it/s]
 48%|####8     | 48/100 [00:00<00:00, 179.03it/s]
 67%|######7   | 67/100 [00:00<00:00, 149.39it/s]
 83%|########2 | 83/100 [00:00<00:00, 129.91it/s]
 97%|#########7| 97/100 [00:00<00:00, 115.31it/s]
100%|##########| 100/100 [00:00<00:00, 130.51it/s]
     average     deviation  min_exec  ...  context_size  x_name                fct
97  0.000022  5.577991e-07  0.000022  ...           232    9710  ddot_array_16_sse
98  0.000022  3.351084e-07  0.000022  ...           232    9810  ddot_array_16_sse
99  0.000022  3.721556e-07  0.000021  ...           232    9910  ddot_array_16_sse

[3 rows x 9 columns]
Let’s display the results
cc = concat(dfs)
cc['N'] = cc['x_name']

fig, ax = plt.subplots(2, 2, figsize=(10, 10))
cc[cc.N <= 1100].pivot(
        index='N', columns='fct', values='average').plot(
    logy=True, logx=True, ax=ax[0, 0])
cc[cc.fct != 'dot_product'].pivot(
        index='N', columns='fct', values='average').plot(
    logy=True, ax=ax[0, 1])
cc[cc.fct != 'dot_product'].pivot(
        index='N', columns='fct', values='average').plot(
    logy=True, logx=True, ax=ax[1, 1])
ax[0, 0].set_title("Comparison of cython ddot implementations")
ax[0, 1].set_title("Comparison of cython ddot implementations"
                   "\nwithout dot_product")

###################
# :epkg:`numpy` is faster but we are able to catch up.
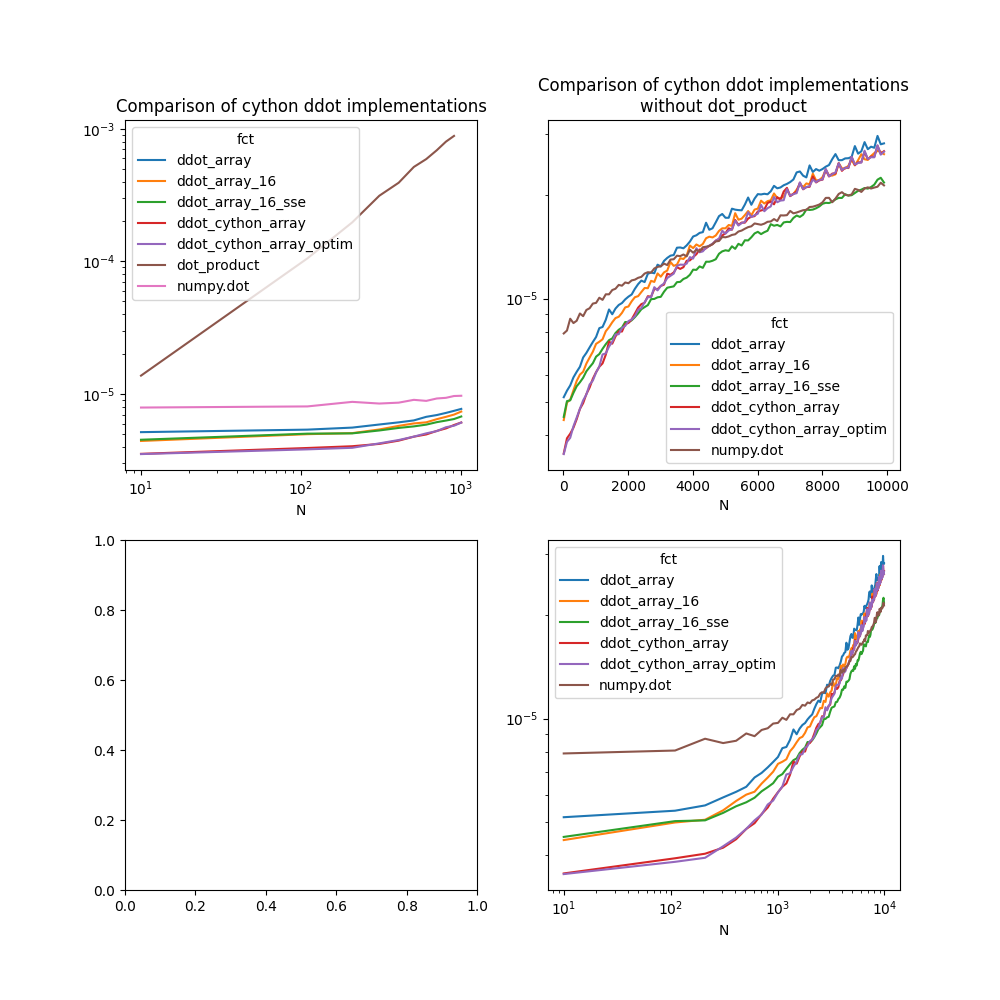
Text(0.5, 1.0, 'Comparison of cython ddot implementations\nwithout dot_product')
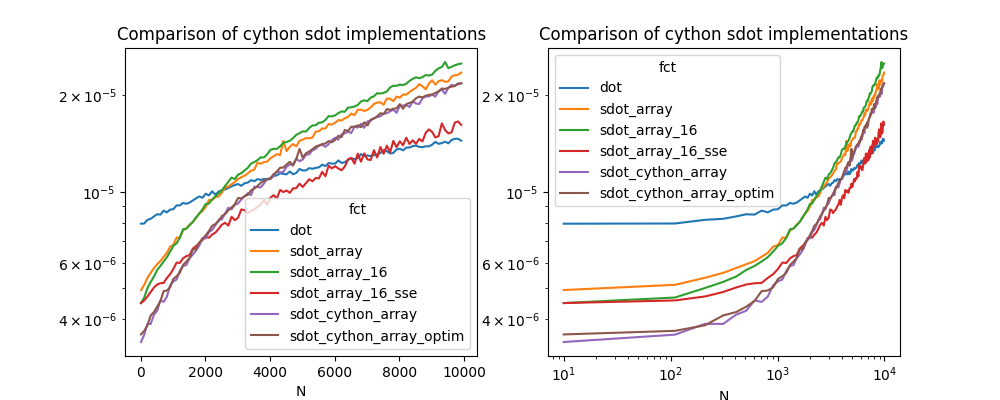
Same for floats
Let’s for single floats.
dfs = []
for fct in [numpy.dot, sdot_cython_array,
            sdot_cython_array_optim, sdot_array,
            sdot_array_16, sdot_array_16_sse]:
    ctxs = get_vectors(fct, 10000 if fct.__name__ != 'dot_product' else 1000,
                       dtype=numpy.float32)

    df = DataFrame(list(measure_time_dim('dot(va, vb)', ctxs, verbose=1)))
    df['fct'] = fct.__name__
    dfs.append(df)
    print(df.tail(n=3))


cc = concat(dfs)
cc['N'] = cc['x_name']

fig, ax = plt.subplots(1, 2, figsize=(10, 4))
cc.pivot(index='N', columns='fct', values='average').plot(
    logy=True, ax=ax[0])
cc.pivot(index='N', columns='fct', values='average').plot(
    logy=True, logx=True, ax=ax[1])
ax[0].set_title("Comparison of cython sdot implementations")
ax[1].set_title("Comparison of cython sdot implementations")

plt.show()
  0%|          | 0/100 [00:00<?, ?it/s]
 20%|##        | 20/100 [00:00<00:00, 190.05it/s]
 40%|####      | 40/100 [00:00<00:00, 173.93it/s]
 58%|#####8    | 58/100 [00:00<00:00, 162.51it/s]
 75%|#######5  | 75/100 [00:00<00:00, 152.53it/s]
 91%|#########1| 91/100 [00:00<00:00, 143.92it/s]
100%|##########| 100/100 [00:00<00:00, 149.66it/s]
     average     deviation  min_exec  ...  context_size  x_name  fct
97  0.000015  3.155293e-07  0.000014  ...           232    9710  dot
98  0.000015  1.468500e-07  0.000015  ...           232    9810  dot
99  0.000014  1.669699e-07  0.000014  ...           232    9910  dot

[3 rows x 9 columns]

  0%|          | 0/100 [00:00<?, ?it/s]
 27%|##7       | 27/100 [00:00<00:00, 265.89it/s]
 54%|#####4    | 54/100 [00:00<00:00, 188.59it/s]
 75%|#######5  | 75/100 [00:00<00:00, 151.64it/s]
 92%|#########2| 92/100 [00:00<00:00, 129.02it/s]
100%|##########| 100/100 [00:00<00:00, 138.67it/s]
     average     deviation  min_exec  ...  context_size  x_name                fct
97  0.000021  3.340554e-07  0.000021  ...           232    9710  sdot_cython_array
98  0.000022  2.817824e-07  0.000021  ...           232    9810  sdot_cython_array
99  0.000022  2.751985e-07  0.000022  ...           232    9910  sdot_cython_array

[3 rows x 9 columns]

  0%|          | 0/100 [00:00<?, ?it/s]
 27%|##7       | 27/100 [00:00<00:00, 262.34it/s]
 54%|#####4    | 54/100 [00:00<00:00, 186.25it/s]
 74%|#######4  | 74/100 [00:00<00:00, 151.54it/s]
 91%|#########1| 91/100 [00:00<00:00, 128.38it/s]
100%|##########| 100/100 [00:00<00:00, 137.25it/s]
     average     deviation  ...  x_name                      fct
97  0.000021  1.909457e-07  ...    9710  sdot_cython_array_optim
98  0.000022  1.676055e-07  ...    9810  sdot_cython_array_optim
99  0.000022  2.160350e-07  ...    9910  sdot_cython_array_optim

[3 rows x 9 columns]

  0%|          | 0/100 [00:00<?, ?it/s]
 23%|##3       | 23/100 [00:00<00:00, 226.99it/s]
 46%|####6     | 46/100 [00:00<00:00, 173.81it/s]
 65%|######5   | 65/100 [00:00<00:00, 144.37it/s]
 81%|########1 | 81/100 [00:00<00:00, 124.69it/s]
 95%|#########5| 95/100 [00:00<00:00, 110.33it/s]
100%|##########| 100/100 [00:00<00:00, 123.78it/s]
     average     deviation  min_exec  ...  context_size  x_name         fct
97  0.000023  3.688558e-07  0.000023  ...           232    9710  sdot_array
98  0.000023  3.984308e-07  0.000023  ...           232    9810  sdot_array
99  0.000024  2.334309e-07  0.000023  ...           232    9910  sdot_array

[3 rows x 9 columns]

  0%|          | 0/100 [00:00<?, ?it/s]
 24%|##4       | 24/100 [00:00<00:00, 227.99it/s]
 47%|####6     | 47/100 [00:00<00:00, 169.32it/s]
 65%|######5   | 65/100 [00:00<00:00, 139.37it/s]
 80%|########  | 80/100 [00:00<00:00, 119.84it/s]
 93%|#########3| 93/100 [00:00<00:00, 105.75it/s]
100%|##########| 100/100 [00:00<00:00, 118.01it/s]
     average     deviation  min_exec  ...  context_size  x_name            fct
97  0.000025  2.212216e-07  0.000025  ...           232    9710  sdot_array_16
98  0.000025  2.703401e-07  0.000025  ...           232    9810  sdot_array_16
99  0.000025  3.103866e-07  0.000025  ...           232    9910  sdot_array_16

[3 rows x 9 columns]

  0%|          | 0/100 [00:00<?, ?it/s]
 26%|##6       | 26/100 [00:00<00:00, 257.58it/s]
 52%|#####2    | 52/100 [00:00<00:00, 206.50it/s]
 74%|#######4  | 74/100 [00:00<00:00, 175.35it/s]
 93%|#########3| 93/100 [00:00<00:00, 153.72it/s]
100%|##########| 100/100 [00:00<00:00, 163.23it/s]
     average     deviation  min_exec  ...  context_size  x_name                fct
97  0.000016  3.493588e-07  0.000016  ...           232    9710  sdot_array_16_sse
98  0.000017  2.715932e-07  0.000016  ...           232    9810  sdot_array_16_sse
99  0.000016  2.943432e-07  0.000016  ...           232    9910  sdot_array_16_sse

[3 rows x 9 columns]
Total running time of the script: ( 0 minutes 20.683 seconds)